


Mobile advertising to pass the $100 billion mark for the first time
Digital media has now surpassed linear television to become the No.1 category in advertising revenues. Within digital, the majority of advertising sales (54%) is now generated by impressions and clicks on mobile devices. The data are gathered from Magna Advertising’s Spring Forecast, June 2017. Globally, media owners advertising revenues are projected to grow by +3.7% in 2017, to $504 billion. This is a noticeable drop compared to 2016 which displayed a record +5.9% growth rate. Global advertising growth is expected to re-accelerate to +4.5% in 2018, with the return of even-year events (Football World Cup in Russia, Mid-Term U.S. elections, Winter Olympics in South Korea).

Online advertising sales will grow by 14% this year while offline ad sales (television, print, radio, out-of-home) will decrease by -2% (last year was flat), but it will pass the $200 billion mark ($204 billion) to become the #1 category globally, with 40% of total ad sales vs 36% for television. Within digital, the majority of advertising sales (54%) is now generated by impressions and clicks on mobile devices.
The star of these years, the mobile advertising will be passing the $100 billion mark for the first time this year ($110bn), while the video and social formats will continue to drive digital advertising growth (+30% or more) with paid search growing double digits again (+13%) to remain the number one format (almost half of digital ad sales). The two digital-native advertising formats or environments (search and social) now represent a combined 70% of total digital ad spend and will capture 85% of the net growth this year. For the second year in a row, social video formats (counted as “social” by MAGNA) will represent a major driver to digital spend, attracting major consumer brands in the social environment where, until recently, there was not significant spend in this category.

While this is slower than last year’s 51.6% mobile growth rate, it represents $27 billion of incremental mobile advertising spend, which is in line with last year’s $28 billion of incremental mobile spend. Mobile isn’t losing any momentum; growth rates are only declining because of the increasing base of mobile advertising spend. This strong growth contrasts with desktop growth, which is expected to shrink by -2.2% this year. This is the second consecutive year of negative desktop advertising growth, and it is expected to continue to decline for the foreseeable future. Within digital, search advertising is by far the largest portion of spend; search is expected to grow by 13% this year to reach $99 billion, or just under half of total digital advertising budgets. This growth represents 30% mobile search growth, and desktop search shrinking by -3%. Mobile search advertising has passed the halfway point to become the majority of search advertising spend, with 55% total share expected this year. Furthermore, the incremental $11 billion of search advertising spend represents over 40% of total incremental digital dollars. Search has been especially strong because of both continued new product innovations such as search re-marketing and customer match lists, along with the growth of non-core search such as Alibaba product listings. Furthermore, search advertising continues to be strong because of its position in the advertising funnel and the ease with which search activity can be connected to customer behavior and sales. Looking forward, search advertising will remain robust, growing around 10% annually to reach $140 billion by 2021. At that point, it will be larger than newspaper, magazines, radio, and OOH combined.

Equally important within digital advertising is social media, which is expected to grow by +32% this year to reach $42 billion, slightly ahead of prior expectations for +29% growth. Social advertising is the fastest growing portion of digital spend, and like search, this is because of mobile platforms. 85% of total social advertising dollars are coming from mobile devices, the highest share of any digital sub-format. Furthermore, social’s 31.6% growth rate represents $10 billion of incremental spend. This is nearly as much as can be found in search advertising despite social being less than half the total size. Growth comes both 10/17 from increased social usage and penetration, as well as new product innovations, including social video, and increasingly dense ad loads on social media. Looking forward, mobile advertising will continue to be dominant in social: by 2021 it will represent 93% of total social media sales. Impressively, search and social combine to represent more than the total of incremental dollars across all media formats (offline media and shrinking digital formats like banner display are net losers; search and social are the growth engine for global ad spend). Video advertising is growing nearly as quickly as social media; growth this year is expected to be 30%, which will bring total video advertising spend to $23 billion. While desktop video is still showing growth at +14% (unlike most other desktop formats), the engine for online video ad spend growth is mobile (+56% growth expected to bring mobile share of video spend to +45% this year). Mobile video will match desktop next year as the mobile video experience, wireless broadband penetration, and mobile video content continues to improve. By 2021, online video advertising will have passed the $50 billion mark globally, and digital video will represent more than 20% of total video viewing (TV and online video). Banner display and other digital advertising formats (email advertising, online classifieds etc.) are stagnating, with both expected to shrink by around -3% this year. Not only have brands found better outcomes using other digital formats such as search, social, and video, but display inventory is also on the decline. Standard banner online real estate is being replaced by video and other rich media formats.
“The record level of growth in 2016 globally, outperforming economic growth, was caused by marketers willing to embrace the new opportunities offered by digital media (search, social, video, programmatic) on a larger scale, while anxious to preserve their share of voice on traditional linear television, despite rising CPMs costs. In 2017, both digital and offline growth will slow down. Online advertising sales will nevertheless continue to grow by double-digits in most markets (globally +13%), but television ad sales will decline (-1%) due to softer price increases, ratings erosion and the lack of global sports events,” declared Vincent Létang, EVP, Global Market Intelligence at MAGNA and author of the report.
In the UK, online advertising sales will grow by an average 10% through the region, to $42 billion. Digital advertising now represents almost 42% of total advertising in Western Europe, slightly above the global average (40%). The fastest-growing formats will be social media (+37%) and video (+19%) while paid search spending will grow by 10%. Ad revenues from static banners will decrease by 5%. In terms of platform, mobile will capture all the growth (+36% to $19 billion). Mobile ad sales will represent 43% of internet ad sales by the end of 2017, which is slightly below the global average or APAC average.
5 Free Instagram Analytics Tools for Marketers
Finding the right strategy that will for sure help your brand is not an easy task. The right Instagram tools can provide analytics to inform your social media strategy and content scheduling. If you are looking for some free tools to help your business on Instagram, we have 5 ideas that would come in handy.
Instagram Insights
If you’ve set up your Instagram business account, you have access to free analytics through the Instagram app. Instagram Insights provides basic stats for assessing your Instagram marketing efforts. Find out more about your followers, when they’re on Instagram, and what your top posts are. This information will help you choose content more likely to resonate with your audience.
To access these insights, tap the bar chart icon in the top-right corner of the app. The first analytics screen shows high-level insights for the last week and comparison stats for the week before. You can view your total impressions, reach, profile views, and website clicks. It also shows your top posts and stats for your Instagram stories from the last 24 hours. Swipe to the right to see your reach. Swipe right one more time to see website clicks data.
source: TechCrunch
You can also view your top posts insights, just by tapping the see more link next to top posts and the top six posts from the past seven days sorted by impressions. The tool also allows you to see followers insights. Back on the main Insights page for your account, scroll down to the Followers chart of times when your followers are on Instagram. Also, if you’re running paid Instagram ads, the Promotions section of the main Insights screen gives you relevant stats on your campaigns.
Socialbakers
With Socialbakers, you can get a free report on your most popular Instagram photos, filters, and hashtags, and all of your interactions with followers. The most useful sections are the most liked and most commented posts because this information can help inform the types of images you use in future Instagram posts.
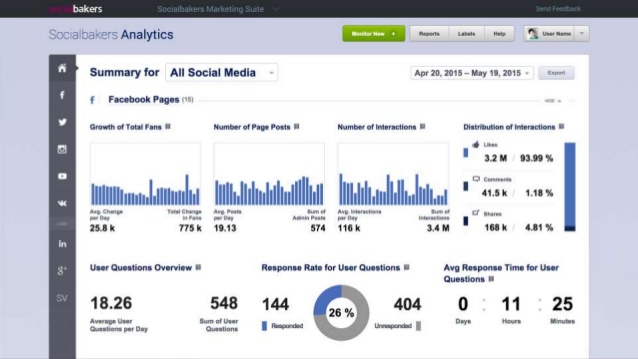
To get your free report, go to Socialbakers’ Free Instagram Analytics Tool and click Login With Instagram.
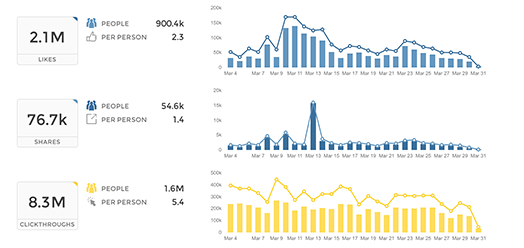
Simply Measured
Simply Measured offers a free Instagram report for users with up to 25,000 followers. The stats and insights are presented clearly and will help inform your Instagram posting strategy. The report lets you quickly see what has worked well in your Instagram marketing, so you can apply these insights to future posts. To get started, type your Instagram account name in the text box and click Authenticate With Any Instagram Account. Then log in and authorize Simply Measured to access information from your Instagram account. When you receive your report, you’ll find three tabs of information: Charts, Scorecard, and Appendix. The buttons in the top-right corner of the screen let you download the report to Excel or export it to PowerPoint.
On the Charts tab, you can view a wealth of insights about your most engaging posts and average engagement per post. Moreover, the Engagement chart shows Instagram engagement over time. See total engagement, engagement as a percentage of followers, and information on likes and comments your photos and videos received.
You can also examine the Scorecard (it gives you some basic stats about your Instagram account) and Appendix Tabs (check out a table of your top posts sorted by highest engagement with the date of the post, type, likes, comments, and total engagement – likes and comments).
It offers a free Instagram account checkup to assess how you’re doing on the network. While the report isn’t as comprehensive as some others, it offers handy nuggets of data for marketers. It helps you determine the best time to post, which hashtags to use, and what content to post more (or less) of. It also highlights your top followers and reminds you to engage with them. To access your free report, click Start Your Checkup on the home page and then sign up for a Union Metrics account.
You can view the number of posts by day. Use the icons in the top-right corner of the page to share, print, or download your report. Scroll down to examine more stats with recommendations from Union Metrics, such as the best time and day to post. You can also view stats and visuals for your top-performing posts. If you click the circles on the hashtag report, you can see more information about the hashtags, which is a handy feature.
Squarelovin
With Squarelovin, you can get free basic Instagram analytics. The Optimization section offers insights that help inform Instagram posting. The “worst times to post” information is especially valuable. First, you’ll need to sign up for a Squarelovin account. On your dashboard, you can view high-level stats and access additional analytics screens. On the Postings tab, you’ll get information on your post history and top posts. It also shows your posts by year and month and day and time. The Engagement tab shows information on likes and comments, and highlights the top liked and top commented posts. The Optimization tab shows the best time and day to post on Instagram, but also the worst times to post on specific days.
If you use different filters on Instagram, you can also view the impact of those filters. Moreover, the report lets you see all of the Instagram hashtags you’ve used next to a list of the most popular hashtags. You can quickly see if you’re using top hashtags or if you need to rethink your hashtag strategy.
Understanding whom your Instagram fans are and what content they engage with and when will give you ideas for future content to share on the network.