


The Health & Fitness Industry Is Estimated To Reach $100 Billion In 2019
This is article #3 of our new series of articles: the Growing Industries series. This series includes articles focused on industries that have experienced continuous growth in previous years to give you valuable insights and inspiration.
Check out our previous articles:
The Gaming Industry – No Longer A Child’s Play
and
The Petfood Industry Is Growing At A Fast Pace.
The Health & Fitness industry is growing at a rate of 10% CAGR and is estimated to reach $100 billion in 2019.
According to the Global Health and Fitness Club Market report, the global health & fitness market revenue reached a total amount of $87.2 billion in 2017 and is projected to grow at a rate of 10.6% between 2018 and 2023.
[bctt tweet=”The Health & Fitness Industry Is Estimated To Reach $100 Billion In 2019″ username=”brand_minds”]
Here are the main findings of this report:
- Consumers are willing to spend more on health and fitness clubs;
- The number of health clubs and gyms with personal training and the latest fitness equipment has increased;
- Yoga, aerobic dance, and swimming have grown in popularity among health and fitness enthusiasts;
- Awareness about the benefits of physical fitness has increased;
- One of the driving factors leading the growth of the industry is the rising cases of obesity especially in developed countries;
- The millennial and baby boomers are joining fitness clubs in raising numbers;
- Corporate wellness activities have seen a growth in demand.
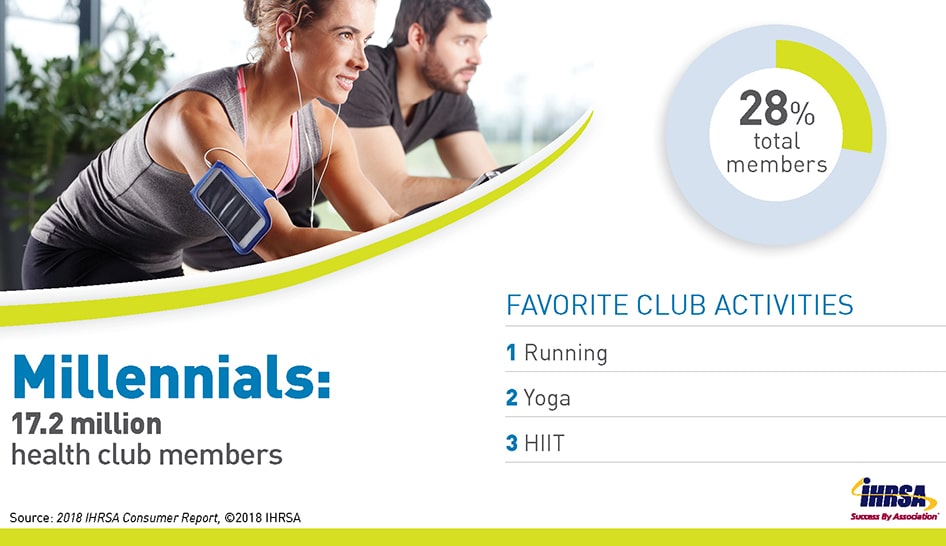
image source: ihrsa.org
The following 5 factors contribute to the health & fitness industry’s growth according to industry analysts:
1.Lowering of the health insurance costs
Healthy people drive insurance costs down and are less of a risk to insurance companies and employers.
Many employers incentivize their employees towards adopting a healthier lifestyle by covering the costs of a health club membership.
2. Increased demand for healthy foods
One of the most common memories we all have of our childhood is our mother telling us Eat your vegetables!
As children, we refused to eat any of the green stuff on the plate, but as adults, we are purposefully looking to eat more healthy foods.
In recent years consumer behaviour has seen a shift in demand: consumers are buying less industrial-scale processed food and more natural or bio foods.
3. Wearables support our decision for a healthier lifestyle
Wearable devices such as Fitbit, Apple Watch and many of the smartphones currently on the market are all helping us achieve our health objectives.
They play the role of personal digital assistants who promptly deliver personalized biometric health statistics. They help us keep track of our progress and steer us towards success.
4. Newfound freedom by streaming exercises classes
People have busy lives.
Women often juggle many activities every day while being mothers, wives, elderly caretakers and employees – all at the same time.
Being free to choose their preferred time to exercise instead of building their schedule around it is key to maintaining a healthy lifestyle. People are streaming fitness exercises classes to save time.
5. Attending outdoor obstacle races and competitions
Competing in outdoor obstacle races beats the ordinary running on a treadmill at the gym.
It’s much more exciting and the competitors feel the adrenaline rush closing on the finish line.
Through mud and water, on sand or grass, these races have been growing in popularity in recent years. The catch is – you need to train for them. That explains the growing demand for wearables and fitness classes.
![]()
5 Top Trends in the Health & Fitness Industry:
- Fitness trackers;
- Bodyweight training;
- Fitness programs for older adults;
- HIIT workouts (high-intensity interval training);
- Group training (a class with more than five people).
Top 3 Countries by Revenue according to IHRSA:
USA – $30 billion
Germany – $5.6 billion
United Kingdom – $5.5 billion
Top 3 Countries by Membership:
USA – 60.9 million
Germany – 10.6 million
United Kingdom – 9.9 million

Behaviour changes have given rise to new key groups in the UK:
- FIT Gen, 25-34-year-olds who prefer varied exercise experiences, in and out of the gym;
- Wellthy Gen, 35-44-year-olds who are striving to enhance their wellbeing by living an interconnected holistic lifestyle;
- Strong Women, a group of 25-44-year-old females who build their physical strength as a way of constructing identities and communities.
Health & Fitness Industry Global Statistics:
- Number of health & fitness clubs members: 174 million;
- Number of health clubs: 201.000; the US has the most health clubs at over 38.000 followed by Brazil with over 34.000;
- The region with the most opportunities for growth: the Asia-Pacific; there are 14 markets in the Asia-Pacific region which attract 22.5 million members at more than 25,000 health clubs.
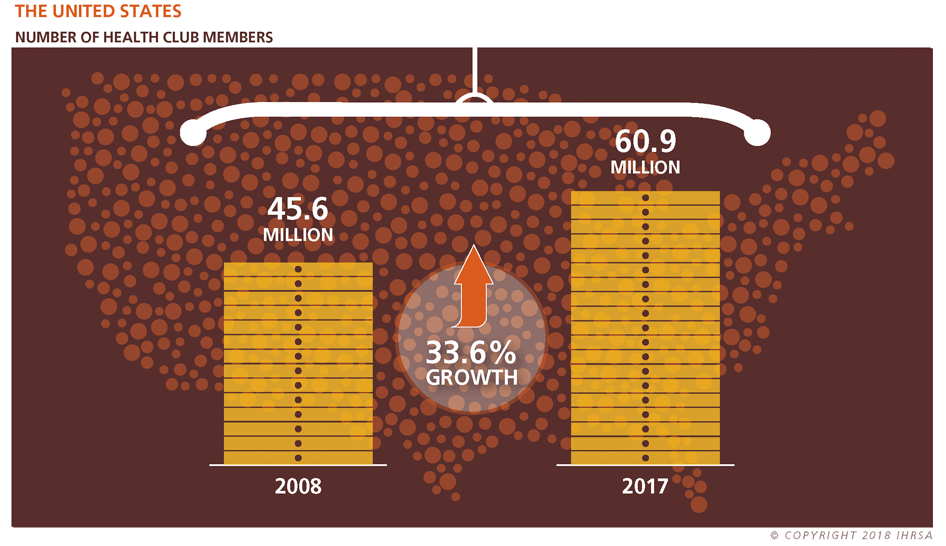
image source: ihrsa.org
Join the Conversation
We’d love to hear what you have to say.
Get in touch with us on Facebook Group and Twitter.
sources:
statista.com
ihrsa.org
2018 – The Year of Augmented Humanity
Isobar predicts that 2018 will be the year of Augmented Humanity, a year where technology enhances and scales our most human attributes. In 2018, technological interfaces will become more natural and instinctive, technology will automate repetitive tasks to free up time for creativity and compassion, and artificial intelligence will meet emotional intelligence.
Isobar’s innovation and strategy experts from around the world have defined five key trends that explore this evolving relationship between humanity and technology and predict a harmonious future. Augmented Humanity explores the ways in which technology enhances and fuels our most human attributes – the ability to recognise and trust each other, to adapt to changing circumstances and the power to deliver true creativity.
Artificial intelligence is great, but humans score on emotional intelligence. The power of being human is in empathy. This cannot be automated or outsourced. Augmented Humanity will use technology to scale everything that is best and most powerful about human interaction.”- Jean Lin, Isobar’s Global CEO.
The report argues that we may one day view the era of anonymous, one size fits all transactions as a temporary blip in our evolution, and that as technology advances it will become more human, not less. It will return us to a time where voice will be the primary way we interact with the world, where we will be recognised and rewarded in stores, and where we will buy more directly from trusted suppliers.
source: medium
Isobar’s five key trends for 2018 explore this intersection of technology and humanity, magic and the machine, code and conscience:
1. Body Talk explores the body as an interface, as our eyes and ears replace touching and tapping.
2. Powered by People tackles the shift from customers to communities as technology turbocharges the sharing economy.
3. The Economy of Me looks at the power of AI to deliver ever more personalised products, prices and places.
4. The Ethical Algorithm tackles technology as a force for good; in a world of fake news and algorithm bias is there such a thing as moral code?
5. The Makers and the Machines explores the extraordinary union of art and technology to create outputs we could never before imagine.
You can download the report here.
Video On Demand and Its Impact On the TV
The most recent research from the Video Advertising Bureau (VAB) shows that live TV is still king, with the majority of viewers watching their favorite programs live, rather than time-shifting, or watching them after they’ve already aired. According to AdWeek, the report also found that 81 percent of viewers who binge video-on-demand (VOD) programming say they can view it at a time that is convenient for them. As a result, VOD ad impressions increased nearly fourfold, to 23.3 billion in 2017 from 6.3 billion in 2014.
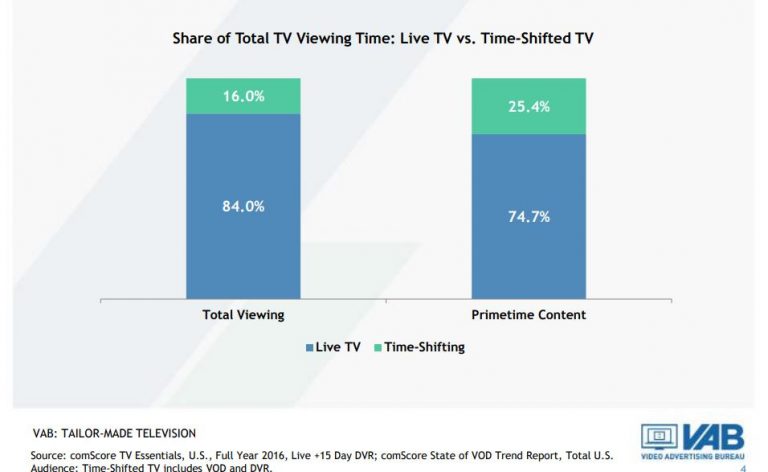
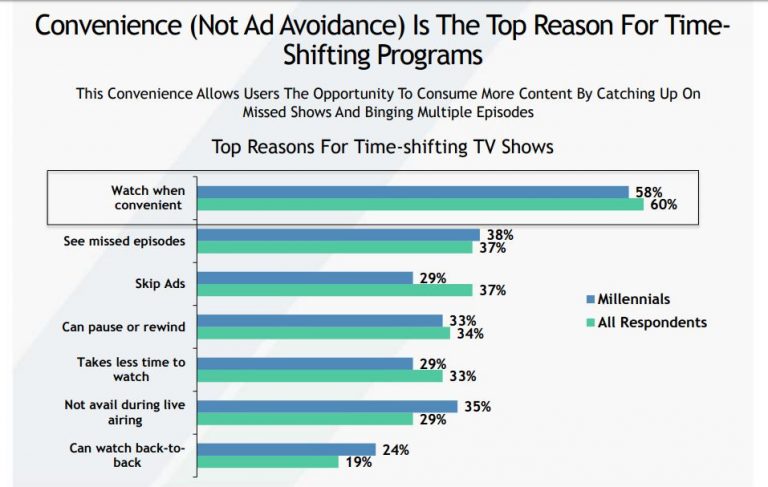
“While live TV remains the first choice for TV viewing regardless of time of day, it’s clear consumers enjoy custom designing their viewing experience to access more content, catch up on missed episodes and binge-watch at their convenience,” said Sean Cunningham, president and CEO, VAB,quoted by AdWeek. “[The research proves] TV isn’t going away—it’s everywhere.”
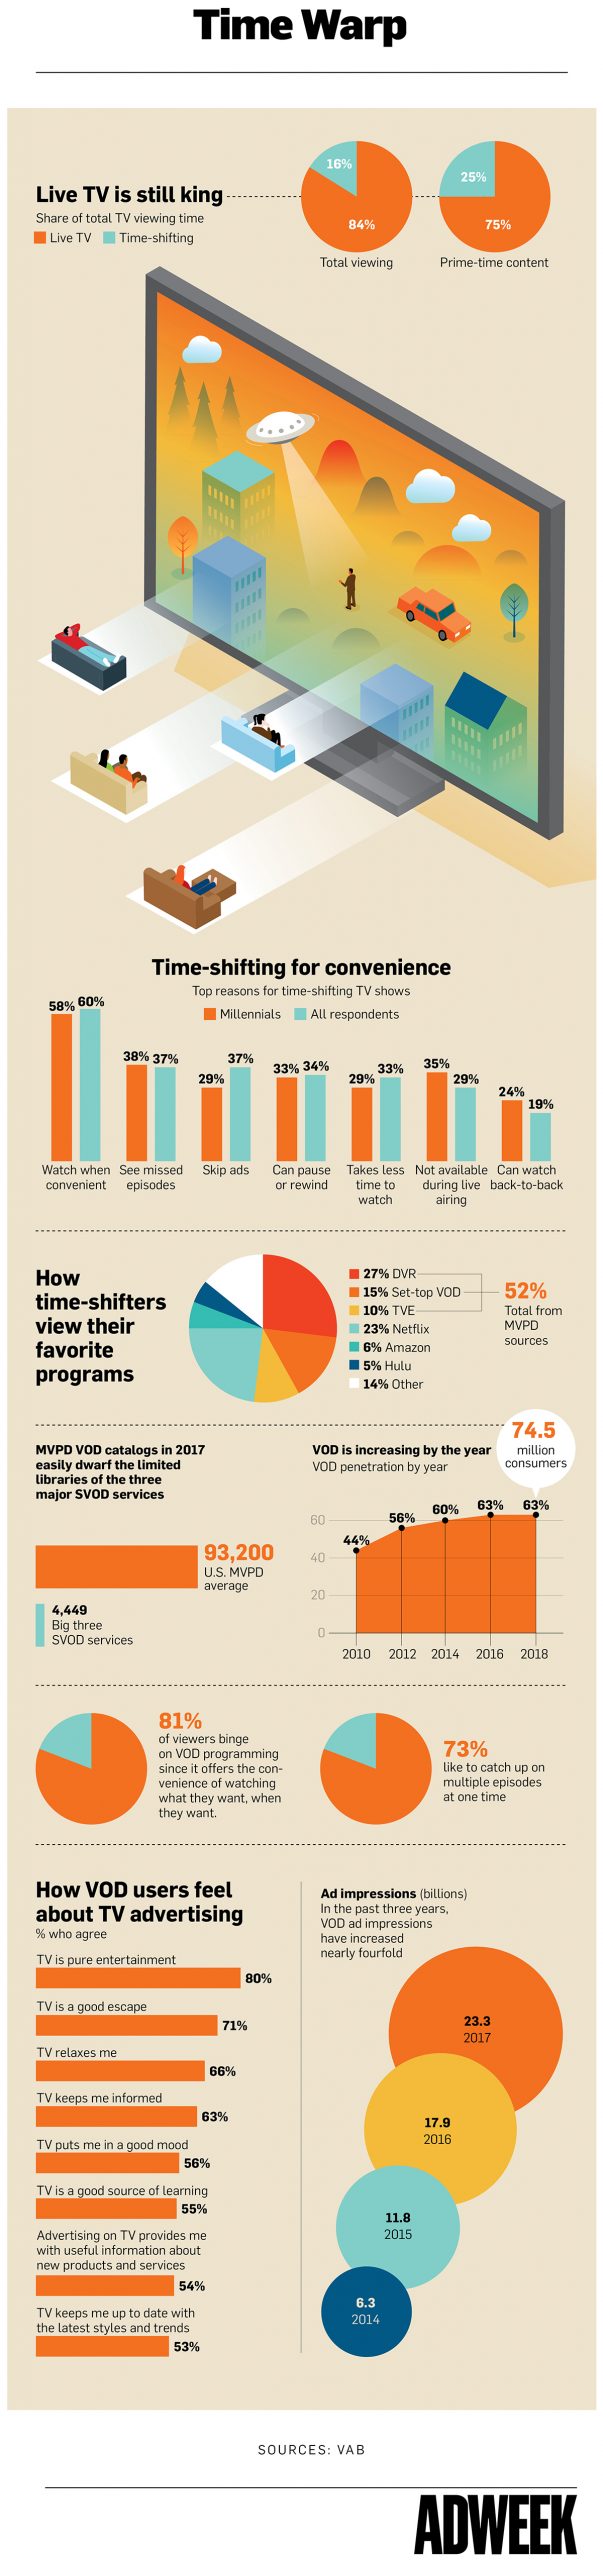
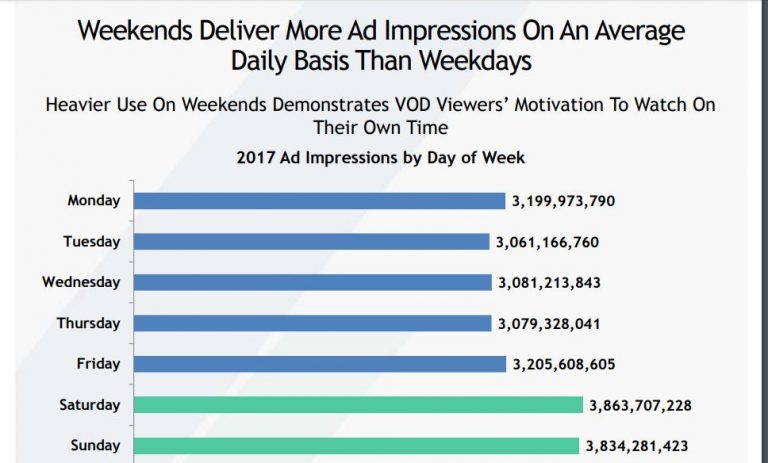
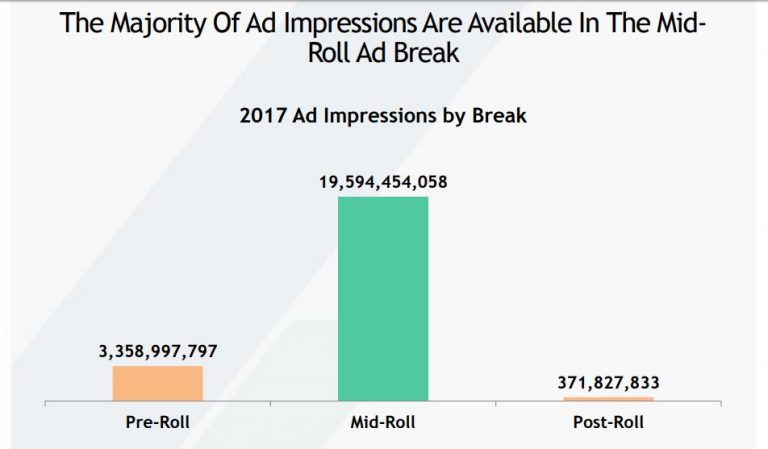
Slides’ source: VAB
How Luxury Marketing Will Look Like in 2018
The concept of luxury is changing, just like everything we are surrounded by is, like our preferences and sometimes passions. Consumer expectations of luxury continue to rise, and that what used to be luxury is now seen by the current generation of consumers, everyday experiences. And, as always, technology has a big part in this change as it makes everything easier,closer and more affordable, therefore what some years ago was considered luxury today might not be so. And just like what today is luxury in the years to come might not be anymore. The definition of luxury is changing, while “upper luxury” appears.
According to Deloitte’s “Global Powers of Luxury Goods 2018”, the world’s 100 largest luxury goods companies generated sales of US$217 billion in FY2016 and the average luxury goods annual sales for Top 100 companies is now US$2.2 billion. The report discusses the trends and issues that are driving the luxury industry. It also identifies the 100 largest luxury goods companies based on publicly available data for FY2016 (which they define as financial years ending within the 12 months to June 2017), and evaluates their performance across geographies and product sectors.
The growing importance of non-western markets for the luxury goods industry has been supported by supply chain leadership, technological innovation and international investment. These factors will help maintain further strong
growth in these geographical markets.
Deloitte’s “Global Powers of Luxury Goods 2018” points out:
Luxury brands have refocused their business strategies to capitalise on these changes. Giorgio Armani is engaged in an in-store installation collaboration agreement with Colombian artist Marta Luz Gutiérrez, while Louis Vuitton is conducting an advertising campaign using a
building designed by the late Mexican architect Luis Barragán. Rising prosperity in major cities and growing formal market power over the black market will ensure sustained Rest of the World (ROW) demand for luxury goods. To succeed in this context, luxury players should focus their investments on digital connectivity, upwardly mobile consumers and bold business models, which are key components of the
personal luxury industry today.
Some aspects that marketers must pay attention and act on in 2018:
Still according to Deloitte, collectively, Millennials and Generation Z will represent more than 40 per cent of the overall luxury goods market
by 2025, compared with around 30 per cent in 2016. Unlike Baby Boomers, many Millennial luxury consumers expect to interact with brands across a range of digital platforms, rather than only through traditional channels. Millennial consumers are also important for in-store shopping and expect a high-value, customized experience. Luxury brands should seek to change their business models to meet this demand, for example by providing more loyalty
programs and invitations to in-store events.
Customize your approach according to your audience. Personalization is still key as a marketing technique to be used as 45% of luxury consumers are asking for personalized products and services. With different expectations, younger
shoppers seek a personalized shopping experience that seamlessly integrates both online and offline platforms. This shift has motivated demand for connective technology such as Augmented Reality (AR) and Artificial Intelligence
(AI). By using AR and AI technologies, luxury brands can provide a personalized consumer experience, reach a wider audience, deepen product experience, and build stronger customer relationships. In parallel, the development of technologies such as voice commerce and the Internet of Things (IoT) are reshaping the entire luxury industry.
Luxury brands positioned as reliable sources of AI-driven recommendations are improving how they engage with consumers. More widespread adoption of AI is also making consumers increasingly reliant on suggestions and advice
provided by their various devices, rather than making decisions based on personal experience.
Social media becomes an important marketing tool for luxury as well. Instagram became the leading social media platform for fashion designers. Gucci more than doubled its Instagram followers between 2016 and March 2018, with successful Insta-campaigns such as #TFWGucci.
In future, the biggest challenge for luxury brands will be to make optimum use of social media without compromising their brand values. The success of a social media strategy will be converting “likes” into an interactive and engaging experience for customers.- Deloitte
An omnichannel approach – onnichannelluxury
A true omnichannel global market environment would require luxury brands to close gaps in customer experiences across channels, to offer a seamless, unified brand experience irrespective of the device or physical touchpoint used. Therefore, each channel needs to interact with and support
others to establish a single brand presence. Demand for an omnichannel approach is a natural development from the spread of digital technology and
e-commerce markets. During this process of change, the ability of luxury brands to leverage available inventory will be a key differentiator.
Digital must remain a priority to define an omnichannel strategy compatible with target expectations. The percentage of online sales perceived as being additional, and not a cannibalization of, physical sales is decreasing each year, with China the least cannibalized country to date.
“Luxury brands should develop their mobile strategy: 55% of luxury consumers buying online use their mobile phones versus personal computers. Peaks appear among the youngest generations and Chinese consumers, 75% and 77%, respectively, of whom use mobile. Social media and influencers are gaining power. For the first time, social media is the first source of information and the channel of primary impact used by true-luxury consumers, followed by magazines and brand websites. Five platforms (Facebook, Instagram, WeChat, Weibo, and QQ) are dominating the social media world, but Facebook is losing momentum to Instagram in the Western world and QQ is losing momentum to WeChat and Weibo in China,” states in “True-Luxury Global Consumer Insight”, the fifth edition of an annual study by The Boston Consulting Group (BCG) and Altagamma.
Millennials: Consumer Aspirations Are Disrupting Luxury
Collaborations with streetwear brands and artists are becoming the norm for Generation Zers and Millennials. “Collaboration covers demand for newness in a less risky way. It gives brands a cool edge and strengthens brand awareness as well as increases willingness to buy the brand. Collaboration is increasingly in demand and turns out to be a very effective purchasing incentive,” said Olivier Abtan, a partner in BCG’s Paris office and the global leader of the firm’s luxury, fashion, and beauty topic.
Unlike “absolute luxurers,” who buy luxury items exclusively, millennials do not hesitate to mix and match. According to BCG’s study, about 55% of this group trades down to buy handbags or T-shirts from cheaper brands, or mixes their style by buying sneakers and luxury shoes from luxury niche brands (including luxury sports). This trend appears to fulfill consumers’ need to create their own style. When they do look for different brands, it’s because luxury brands don’t have offerings in certain categories or because of the Millennials’ desire to have a unique style, express themselves, and seek out niche brands.
Use iconic personalities in your communication
With all the big changes, some things are meant to last and take the test of time. Chanel’s iconic marketing history began with a print advertisement for its perfume, Chanel No.5, in 1921. Its first celebrity endorsement didn’t feature until 1954, with Marilyn Monroe. However, it wasn’t until 2005 when Chanel first adopted videography, and from here, the rest is history.

“Despite not adopting social media and integrating the platform with videography until 2009, its marketing strategy is nothing short of stupendous. Selecting admirable public figures such as Keira Knightley and Nicole Kidman to star in Chanel’s unmistakable short films, revived the brand as an iconic symbol of both cultural and digital relevance. With the use of video and social media integration, Chanel has grown to having more than 57 million social followers globally, the highest in the luxury fashion industry. The brand focused on Facebook as their initial social media platform, due to the video capabilities such as extended video length, that Twitter and Instagram do not support. For the brand’s primary consumer, the more wealthy and mature client, Facebook was the ideal platform for accessing this demographic,” wrote Little Agency.
Sensory Branding
According to Retail Insider, British Airways is encashing big on a recent study on sensory sciences by Oxford about how sound influences the taste of food. Based on the findings of this study, they launched a list of 13 in-flight tracks to enhance the taste of the meals served during the flight, providing a truly luxurious experience. Moreover, Soundwich in Portugal delivered gourmet sandwiches packed in metal boxes that play music chosen by the chef when opened.
More ideas you can see here.
The digital out-of-home advertising is already blooming
The share of global advertising spend going to out-of-home (OOH) advertising remains stable at 6 percent, shows ‘Why Out Of Home Performs’, a joint study by Magna Intelligence and Rapport, IPG Mediabrand’s out-of-home agency, into OOH’s continued growth and impact. The report was based on findings from an analysis of the global OOH industry and OOH advertising in 70 countries. This is largely down to major investment in digital OOH (or DOOH), which is growing in every environment and has seen unit numbers jump 70,000 to 300,000 worldwide in two years, and revenue increase by 30 percent.
Digital OOH is boosting advertising revenues by creating more opportunities for marketers in premium locations like airports or malls, thus increasing the revenue per panel multiple times. Although digital units account for only 5% of the global OOH inventory, they already generate 14% of total advertising revenues. In fact, DOOH already accounts for 30% of revenues in some markets like the UK and Australia, and the global share is predicted to grow to 24% globally by 2021.
“With the explosive growth of digital-out-of-home (DOOH), the diversified lifestyle touch points it reaches, and the veritable mountain of mobile driven audience data, we are best positioned to accurately, and in real-time, track audiences and deliver contextually relevant messages through out-of-home media. OOH’s sustained growth on a global scale will further enable us to create engaging consumer experiences,” said Mike Cooper, Global CEO Rapport.
source: Campaign Asia
“The digital-out-of-home market is a return to advertising’s roots, quietly shifting the industry by way of re-imagining the classic advertising experience. Nearly $4.5 billion is expected to be spent on DOOH advertising in the U.S. by 2019, an increase of approximately $1.2 billion from 2016. Zenith forecasts that DOOH will grow faster globally than all other buying methods, and PricewaterhouseCoopers predicts that DOOH advertising revenues will overtake traditional media spend in 2020, growing at a rate of 15% a year for the next four years,” writes AdAge.com.
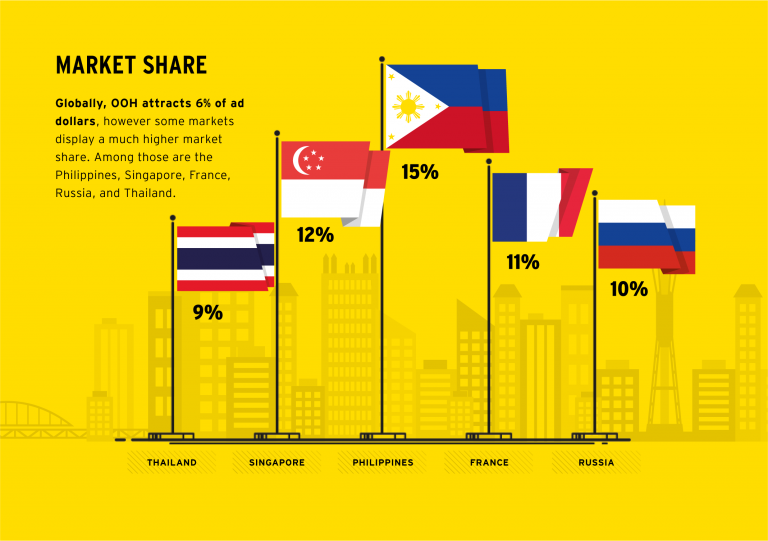
According to MAGNA, OOH advertising is now a $29 billion market, responsible for approximately 6% of the $500 billion global advertising spending. However, OOH market share increases to 10% to 12% in some countries, including France and Russia, compared with other media categories including Internet, TV, print and radio. OOH market share has remained stable in the last five years, hovering around 6%. However, as part of its increasing importance in the media mix, OOH market share has increased from 8% to 10% of traditional media advertising spend, which includes TV, print, radio and out-of-home, among other categories.
MAGNA Intelligence, in partnership with Rapport, conducted an in-depth survey in 22 key markets including Argentina, Australia, Belgium, Canada, China, Denmark, France, Germany, India, Italy, Japan, Malaysia, Mexico, Netherlands, Norway, Philippines, Russia, Singapore, Spain, Thailand, United Kingdom and the United States. The objective of the survey was to assess OOH advertising’s sustained growth and impact during a period where offline marketing budgets are stagnating and other media categories are struggling.
Moreover, MAGNA showed in another study launched in June, that in the USA, Out-of-Home (OOH) advertising is expected to grow +2% to $7.9 billion in 2017, including cinema. MAGNA reduces its 2017 growth forecast following weak first quarter advertising sales, which grew by just +0.3% in a sudden slowdown, as seven of the last eight quarters had shown year-over-year growth of +3% or more. The 1Q17 stagnation occurred as a result of several key verticals reducing spend, including both automotive and food & beverage, which both experienced double-digit declines. This offset the continued growth from tech brands (e.g. Google, Apple, Hulu and Netflix) that have driven OOH sales over the last two years.

The DOOH market encapsulates everything from digital billboards to screens in elevators to screens on jukeboxes. Unlike internet or mobile advertising, it allows advertisers to reach target audiences in a specific, real-world context. Instead of interrupting an internet user’s online experience with an ad, it’s focused on marketing to consumers when they are “on the go” in public places or in transit. Due to its specifications, the technology has the opportunity to give to its target the message in a format that’s automated, dynamic and interactive.
“The DOOH space presents a major opportunity for creatives, technologists and consumers alike. We see DOOH’s effectiveness in the numbers: the 2016 Nielsen OOH ad study found 91% of U.S. residents age 16 or older, who have traveled in a vehicle in the past month, noticed some form of OOH, and 79% noticed OOH in the past week. The same Nielsen digital billboards study found 71% of digital billboard viewers find those ads to stand out more than online ads. Ultimately, the emerging digital-out-of-home market is groundbreaking in its interactive technology, but it’s also a return to advertising’s roots and the original purpose around advertising: to provide an engaging and useful service to the public,” writes AdAge.
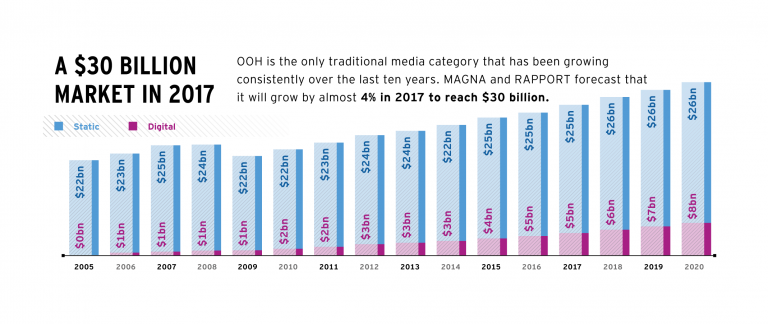
Globally, in 2016, the OOH market was worth $28 billion in net advertising, according to Magna’s report, and is predicted to grow by 4 percent per year to reach $33 billion by 2021. Behind this growth is an ever-more concentrated supply-side market, in which the top international OOH media owners are continuing to expand their influence: the six main global vendors (in order of 2016 revenue size, JCDecaux, Clear Channel, Outfront, Lamar, Stroer and Exterior) now control almost 40 percent of the whole market. By 2021, the report predicts small, but significant changes, in the environments most used for OOH. Use of billboards, currently the top revenue-generating segment and performing particularly well in India, Russia and the US, will drop 4 percent from 45 to 41 in the next five years. Street furniture and transit, meanwhile, are due to grow, respectively, from 31 to 34 percent and from 14 to 15 percent as local authorities become more willing to partner with OOH vendors. A series of major contracts—typically over 10 years long—in big cities are also in the process of renewal, the first time this has happened in the era of DOOH and programmatic opportunities, which partly explains DOOH’s recent giant revenue leap.
According to APAC, while the US is the largest OOH market, valued at $7.1 billion last year, APAC countries Japan ($4.7 billion) and China ($3.1 billion) come in at second and third position and per capita spending on OOH amounts to a record $38 per year in Japan, compared to $22 in the US. Singapore spends the second highest amount per capita at $36 a year. In the Philippines, meanwhile, OOH accounts for one of the highest percentage shares of overall ad spend in the world, at 15 percent compared to the global share of 6 percent. Singapore (12 percent) and Thailand (9 percent) also exceed the worldwide average.
Singapore’s OOH ads have the highest reach range of any other APAC market, with a penetration of 70 to 80 percent of the relevant population, due to its concentrated levels of urbanisation. Australia’s have the second highest, reaching 60 to 70 percent, but neither matches the reach of OOH ads in Argentina, which are considered seen by a huge 85 to 95 percent of the population.
In Australia, DOOH represents more than a third of total OOH spend, which the report attributes to a sophisticated advertising market and a population relatively concentrated in a few urban centers.
In China, the total OOH spend about matches other markets, it is one of the top five global markets in terms of penetration of digital, led by the transit segment. By 2021, MAGNA predicts that digital growth will have doubled, while OOH growth will be stagnating, partly due to lack of interest in non-digital inventory.
“OOH’s natural convergence with other digital media has hurt most other ad forms. OOH complements digital media by amplifying and enhancing it. This phenomenon has brought additional ad revenue to OOH, while most other media have experienced revenue losses as a result of the growth in digital.OOH has benefited from other new technologies, too, such as social media and mobile. Many OOH media campaigns are now picked up on social media, which greatly amplifies the total viewership. When consumers are on mobile devices, OOH is typically one of the last ad forms they’re exposed to just before important path-to-purchase decisions,” explained Steve Nicklin, Vice President of Marketing, OAAA, for billboardinsider.com.
The innovative opportunities provided by the digital platform have provided the OOH industry with new thinking and new ideas. Moreover, in the USA, as shown by the USA Touchpoints/RealityMine study, OOH and Today’s Mobile Consumer, consumers spend more time with OOH than any other form of advertising media except TV. The findings are supported by the 2016 Nielsen OOH ad study that found that 91% of US residents age 16 or older, who have traveled in a vehicle in the past month, noticed some form of OOH, and 79% have noticed OOH in the past week. Their research also discovered impressive levels of engagement, with 82% of billboard viewers reporting they look at the advertising message at least some of the time; and over one-third looking at the billboard ad each time or almost each time they noticed one. The Nielsen digital billboards study found 71% of digital billboard viewers find them to stand out more than online ads.
OOH is expanding to brand new environments. Digital screens have allowed OOH advertising vendors to penetration niche environment allowing to reach young urban population that is otherwise hard to reach by traditional media: offices, elevators, taxi, gyms, bars, retail etc. The “Digital Place-Based” segment offers targeting capabilities and programmatic opportunities. Moreover, OOH becomes addressable and experiments with programmatic. Initially developed to automate the trading of online display ads, the programmatic technologies are now being used in to buy and optimize ad campaigns on connected DOOH units.
Programmatic techniques not only optimize the workflow of media-buying but help brands deliver the right ad in the right place and at the right time, using consumer data and mobile location data. Giving advertisers the ability to plan, buy, optimize and measure the effectiveness of their outdoor campaigns through an online platform represents the natural evolution of OOH’s technology-driven transformation with many vendors developing Private Marketplaces (PMP).
Besides that, DOOH is going social. “There are two main avenues DOOH is being used to complement social campaigns, either through integration or through content creation,” says Neil Morris, founder and CEO of UK-based creative production house Grand Visual.
5 Free Instagram Analytics Tools for Marketers
Finding the right strategy that will for sure help your brand is not an easy task. The right Instagram tools can provide analytics to inform your social media strategy and content scheduling. If you are looking for some free tools to help your business on Instagram, we have 5 ideas that would come in handy.
Instagram Insights
If you’ve set up your Instagram business account, you have access to free analytics through the Instagram app. Instagram Insights provides basic stats for assessing your Instagram marketing efforts. Find out more about your followers, when they’re on Instagram, and what your top posts are. This information will help you choose content more likely to resonate with your audience.
To access these insights, tap the bar chart icon in the top-right corner of the app. The first analytics screen shows high-level insights for the last week and comparison stats for the week before. You can view your total impressions, reach, profile views, and website clicks. It also shows your top posts and stats for your Instagram stories from the last 24 hours. Swipe to the right to see your reach. Swipe right one more time to see website clicks data.
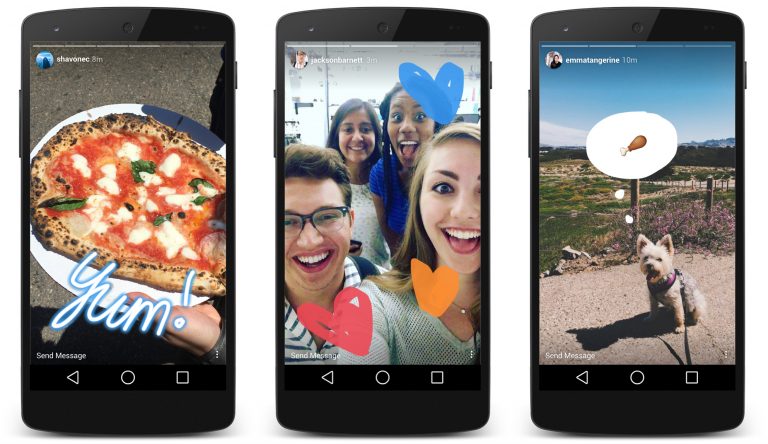
source: TechCrunch
You can also view your top posts insights, just by tapping the see more link next to top posts and the top six posts from the past seven days sorted by impressions. The tool also allows you to see followers insights. Back on the main Insights page for your account, scroll down to the Followers chart of times when your followers are on Instagram. Also, if you’re running paid Instagram ads, the Promotions section of the main Insights screen gives you relevant stats on your campaigns.
Socialbakers
With Socialbakers, you can get a free report on your most popular Instagram photos, filters, and hashtags, and all of your interactions with followers. The most useful sections are the most liked and most commented posts because this information can help inform the types of images you use in future Instagram posts.
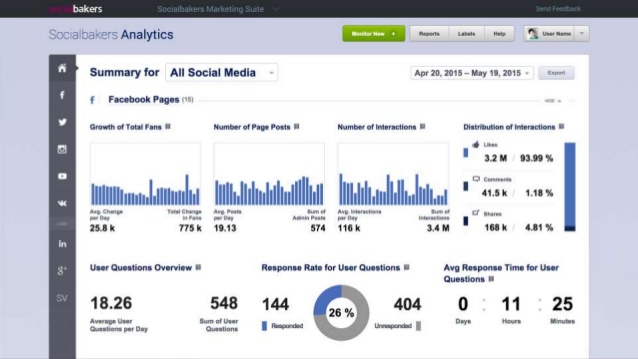
To get your free report, go to Socialbakers’ Free Instagram Analytics Tool and click Login With Instagram.
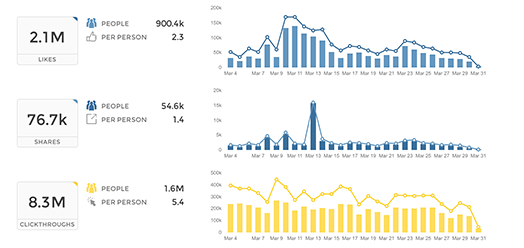
Simply Measured
Simply Measured offers a free Instagram report for users with up to 25,000 followers. The stats and insights are presented clearly and will help inform your Instagram posting strategy. The report lets you quickly see what has worked well in your Instagram marketing, so you can apply these insights to future posts. To get started, type your Instagram account name in the text box and click Authenticate With Any Instagram Account. Then log in and authorize Simply Measured to access information from your Instagram account. When you receive your report, you’ll find three tabs of information: Charts, Scorecard, and Appendix. The buttons in the top-right corner of the screen let you download the report to Excel or export it to PowerPoint.
On the Charts tab, you can view a wealth of insights about your most engaging posts and average engagement per post. Moreover, the Engagement chart shows Instagram engagement over time. See total engagement, engagement as a percentage of followers, and information on likes and comments your photos and videos received.
You can also examine the Scorecard (it gives you some basic stats about your Instagram account) and Appendix Tabs (check out a table of your top posts sorted by highest engagement with the date of the post, type, likes, comments, and total engagement – likes and comments).
It offers a free Instagram account checkup to assess how you’re doing on the network. While the report isn’t as comprehensive as some others, it offers handy nuggets of data for marketers. It helps you determine the best time to post, which hashtags to use, and what content to post more (or less) of. It also highlights your top followers and reminds you to engage with them. To access your free report, click Start Your Checkup on the home page and then sign up for a Union Metrics account.
You can view the number of posts by day. Use the icons in the top-right corner of the page to share, print, or download your report. Scroll down to examine more stats with recommendations from Union Metrics, such as the best time and day to post. You can also view stats and visuals for your top-performing posts. If you click the circles on the hashtag report, you can see more information about the hashtags, which is a handy feature.
Squarelovin
With Squarelovin, you can get free basic Instagram analytics. The Optimization section offers insights that help inform Instagram posting. The “worst times to post” information is especially valuable. First, you’ll need to sign up for a Squarelovin account. On your dashboard, you can view high-level stats and access additional analytics screens. On the Postings tab, you’ll get information on your post history and top posts. It also shows your posts by year and month and day and time. The Engagement tab shows information on likes and comments, and highlights the top liked and top commented posts. The Optimization tab shows the best time and day to post on Instagram, but also the worst times to post on specific days.
If you use different filters on Instagram, you can also view the impact of those filters. Moreover, the report lets you see all of the Instagram hashtags you’ve used next to a list of the most popular hashtags. You can quickly see if you’re using top hashtags or if you need to rethink your hashtag strategy.
Understanding whom your Instagram fans are and what content they engage with and when will give you ideas for future content to share on the network.
The best media mix for your brand in 2017
The media market is changing under our eyes, each year bringing something new. It’s more than obvious that, even if you are representing a smaller brand, it’s not enough to rely on a website or social media page alone if you want to be competitive in the marketplace. Moreover, the media channels that used to work very good for you two or three years ago may very well not be the best ones to use anymore.
According to Initiative and their report Media Fact Book 2016, in Romania the TV continued to be in 2015 the rising engine of the media market, having a push of volumes of 7 percent compared to 2014 and reaching the EUR 212 million margin. Other channels that grew were the online (a boost of 12 percent and reaching EUR 57 million) and the radio (a 5 percent boost, until EUR 19 million). The OOH remained stable at EUR 28 million. Moreover, Initiative estimated that the media market would reach in 2016 EUR 351 million this year, following a 6 percent growth. The evolution on each channel is similar to the one in 2015 – the TV market will grow with 6 percent, the online with 12, the radio with 5, while the OOH will remain the same and the print would continue to drop still with 10 percent. In this context, the approaching of the digital next to the TV in the consumers’ preferences are, the amplitude that the mobile took, the influence of the multi-screening or the forever bigger importance of the content’s quality has over the rise of the media budgets.

source: Linkedin
With a well-chosen media mix, you can build the kind of name recognition and buzz for your company that isn’t possible with single-pronged approach. A mixture of owned, paid and earned media will help ensure your marketing efforts are reaching your target audience.
Consumers want brands that are useful and accessible, and most of all, entertaining. Marketers will continue to pull out all the stops to counter declining ad receptivity. In 2017, we’ll see more branded content and less regular advertising. Get ready for more native content, short and long form video, branded filters, and emoji and PR stunts. But it won’t end here. The specialists forsee that the marketers will forge ahead with new technologies such as 360 video, augmented reality, virtual reality and artificial intelligence (chatbots performing customer service and sales functions), making the landscape ripe for new creativity. Marketers will also closely monitor effectiveness as studies start to show which formats consumers find annoying and intrusive, particularly on mobile.
These advancements create new challenges for marketers. Far from a controlled consumer view of a brand (TV, outdoor, instore), marketers will face multiplatform, multi-device, in and out of walled gardens, all differently experienced by every consumer. Geotargeting will be seen as a commercial opportunity and Snapchat itself is using geofilters to let people know where to find a Snapbot vending booth. Brands will move quickly into customized/personalized creative content, delivered in a targeted way via programmatic buying. We will see more sequential content as marketers consider using retargeting for a more strategic and persuasive catenation of consumer messages.
In a media landscape of ongoing dramatic change, advertisers will more aggressively adopt multiple media alternatives to reach and connect with their audiences throughout 2017. Synergies will become more important than any single channel and the collective weight of all channels put together. Marketers will be focused on understanding the role each media plays within a broader plan and how they rub off to produce synergistic effects. The concept of synergies has been around for some time but what has changed is the planning aspect and the application of a discipline to the selection of channels to maximize its impact. Cross media studies conducted by Kantar Millward Brown show that globally 25% of media effectiveness has been attributed to synergies, and nearly 40% in APAC. These numbers are not only growing but increasingly we are seeing non-TV synergies emerging as advertisers and agencies start to get their heads around this. The two broad parameters needed to leverage synergies are – creative synchronization and media duplication and phasing.

source: Digital Land
„A “big idea” is important for creative synchronization to occur, but it’s also about adapting the message to the medium and following a common theme across a campaign. For example, it’s unlikely that a 30 second TV ad will work as well on YouTube or Facebook because these media have different characteristics. But they offer opportunities for forming different kinds of relationships that meet consumer needs at different times and occasions. Optimising media duplication and phasing can go a long way in driving synergies but as a first step, marketers will need to ensure that every medium has a role to play within the broader media mix. Roles will be in terms of driving ‘reach and or frequency’ or various aspects of how people think, feel and make decisions about the brand,” said Straford Rodrigues, Media & Digital Director, APAC at Kantar Millward Brown.
Therefore, every brand needs to create its media plan accordingly to its target, expectations and business plan. The strategy is more important than ever: setting clear objectives, finding the right opportunities, integrating your message and your true content, exploring, creating, producing and measuring.
Apart from the media planning itself, don’t forget the fact that the content is the KING and it needs to be as powerful, sincere and creative as possible.