


How much time people spend connected to their smart devices?
How much time people spend connected to their smart devices?
The short answer is all the time!
But what all the time means exactly?
Let’s dig in a little deeper!
The 2018 Digital Future in Focus report from ComScore shows very interesting statistics related to our smart devices usage and consumption.
The report investigated 13 countries: USA, Canada, France, Germany, Italy, Spain, UK, Argentina, Brazil, Mexico, India, Indonesia and Malaysia.
Here are our main takeaways:
1.average time spent on connected smart devices: 4 hours
2. multi-platformers (mobile, desktop/laptop, tablet) remain a majority in most markets (46%), mobile only usage is 30% and desktop only – 24%; the countries that stand out is India (80% are multi-platformers) and France (60% desktop users)
3. multi-platformers consumption is still the norm, but mobile only is on the rise
4. mobile users consume more than twice minutes compared to desktop users (e.g.: Argentina 7000 minutes, Canada 2000 minutes)
5. entertainment and video flourish on mobile platforms
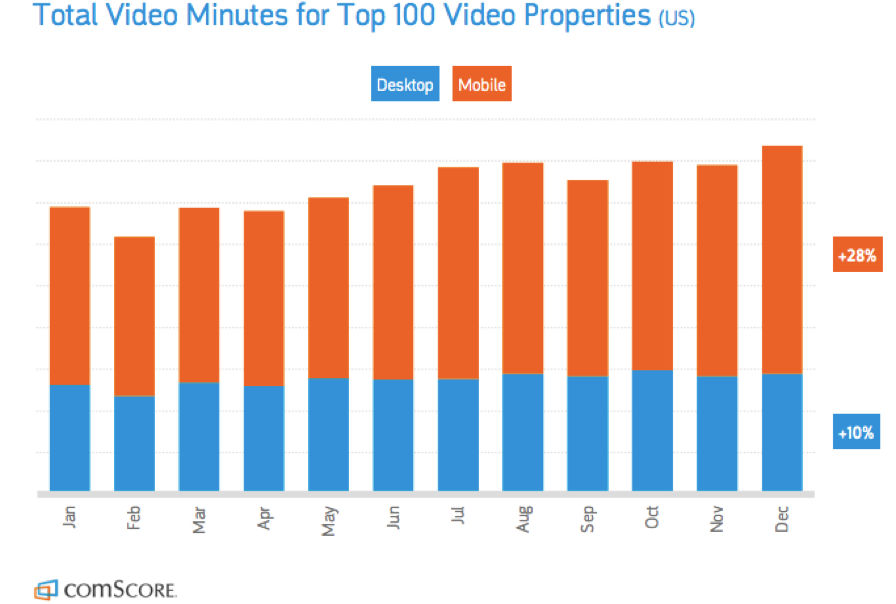
6. smartphone takes largest share of global digital minutes
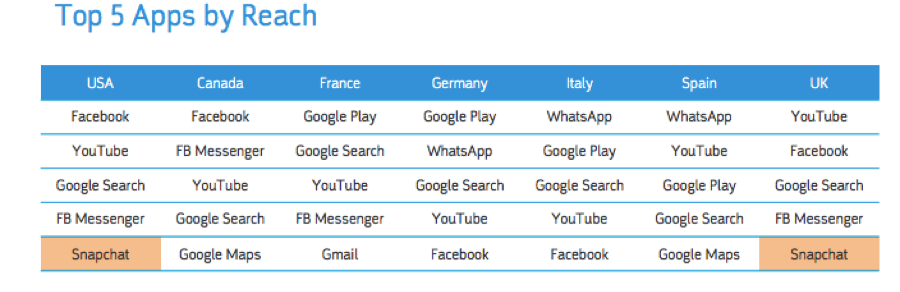
7. here is the top 5 apps by reach
8. mobile apps account for over 80% of mobile time
9. mobile-only audiences are now second only to multi-platform users
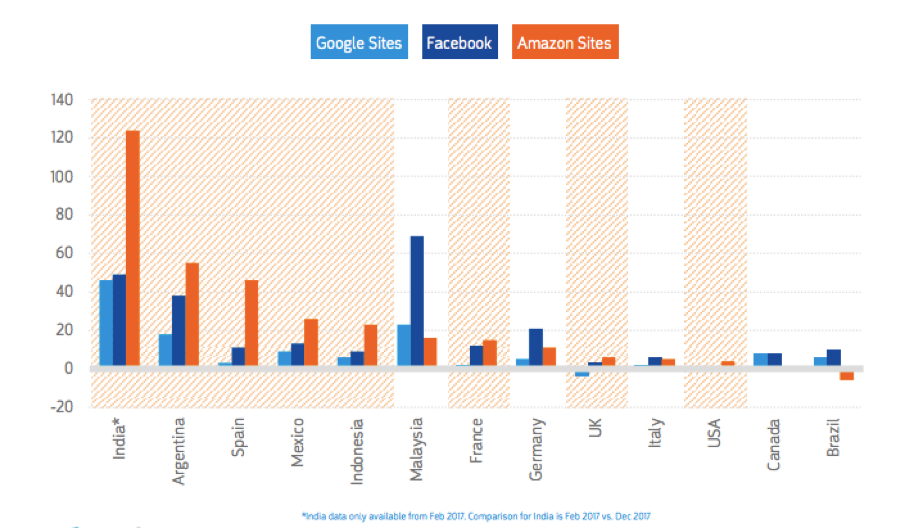
10. Amazon sites are slowly surpassing Facebook and Google sites
11. markets which have a mobile audience larger than its desktop audience: India, Indonesia, Mexico, Spain, Brazil, Italy and Malaysia
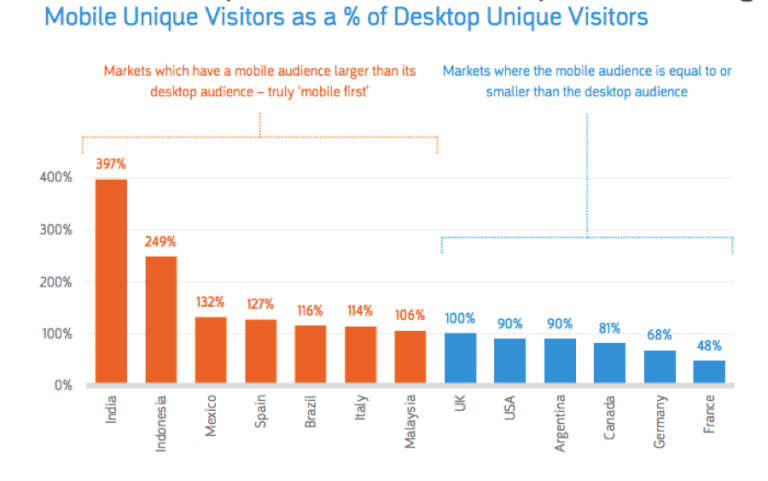
12. markets where the mobile audience is equal to or smaller than the desktop audience: UK, USA, Argentina, Canada, Germany and France
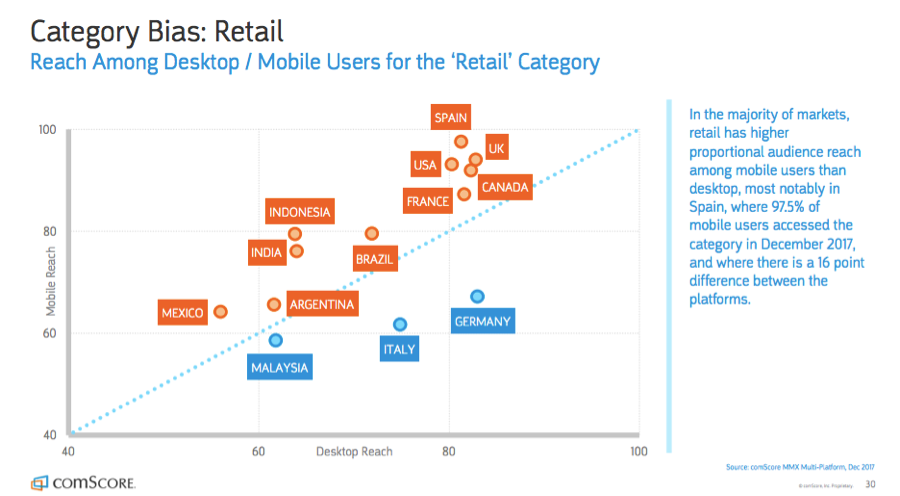
13. in the majority of markets, retail has higher proportional audience reach among mobile users than desktop, with Spain leading by 97,5%; at the other end of the spectrum, there are Germany, Italy and Malaysia where users access retail by desktop
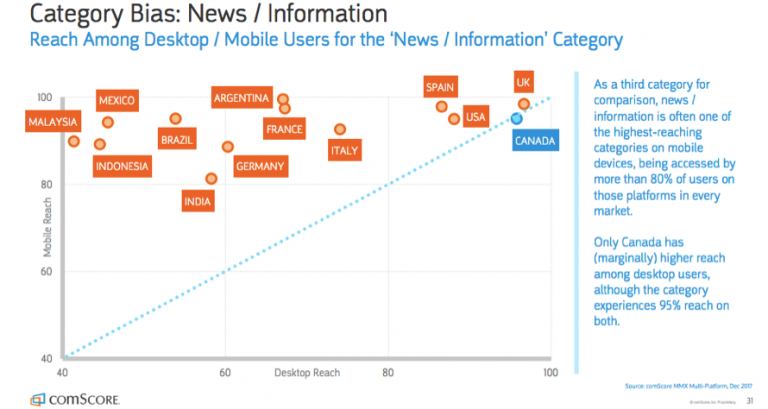
14. when it comes to news and information, 80% of users in all markets access this category by mobile, except Canada where 95% of users turn to desktop
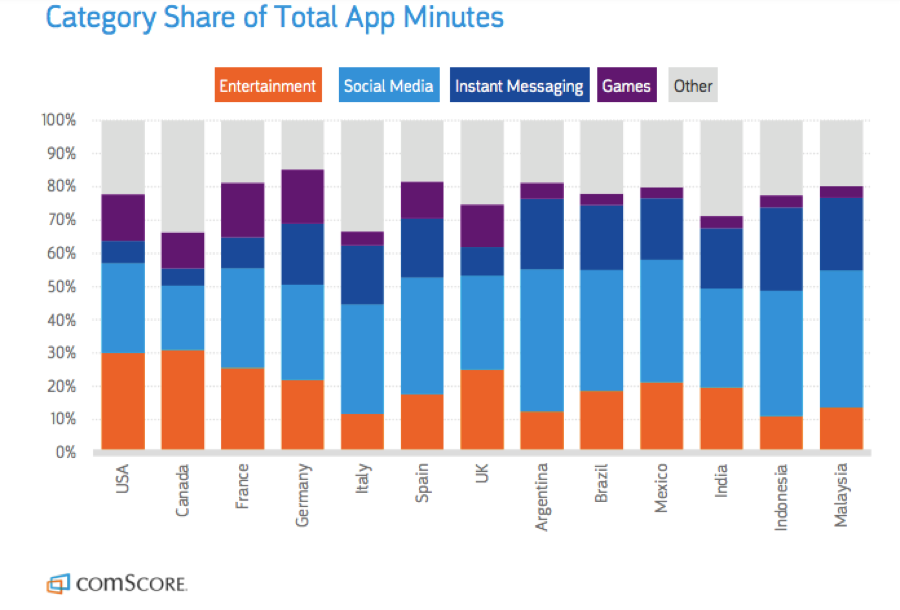
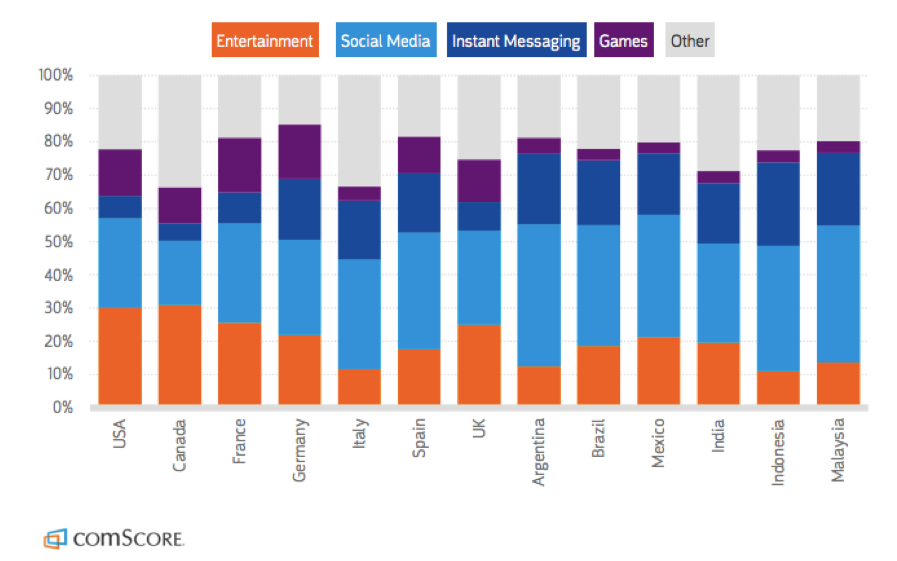
15. people use their app minutes for the following categories in this order: social media, entertainment, instant messaging and games
16. the most popular social network is Facebook by far, followed by Instagram, Snapchat and Twitter
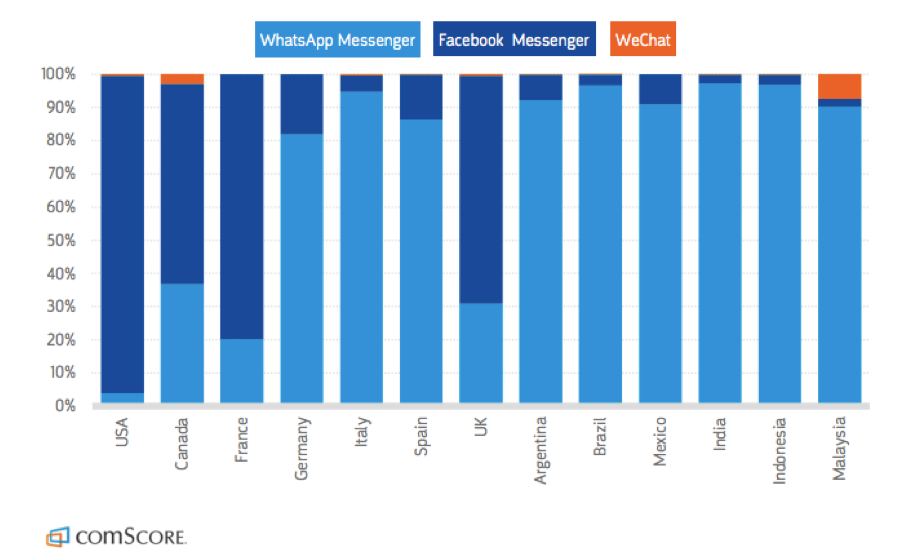
17. most popular instant messaging app is WhatsApp Messenger, followed by Facebook Messenger and WeChat
screenshots: comscore.com