How to make it work for your brand with Facebook’s new changes
After the new Facebook News Feed changes, all of the marcomm industry has been left wondering what are the best ways of keep on bringing success for the brands and the companies.
We are offering you some solutions that we believe will help you and your business:
Put more emphasize on the content and its value. Even you will post less frequently, try and create content that will stimulate the conversation, bringing more comments and shares.
Avoid click and engagement bait
Use Facebook Live. Live videos get the best interaction of Facebook of all the content posted and,moreover, bring instant interaction and reaction from the followers. A manner to attract more people to your live video is to announce your followers you will have a video session and when it will happen, plus add people in your video and invite people to watch. Moreover, the viewers can interact by posing open questions or by submitting questions during the live feed.
Use the “See First” option. What it happens is that when your followers activate this option they’re less likely to miss your updates. All they have to do is click on “Following” and then “See First” on your page and everything is settled.
Get into Messenger Chatbots, learn about them and use them. They will allow you to nurture leads and sell.
“Businesses in the travel, finance, media and entertainment, health, and retail sectors in particular have all found success with these pocket-sized personal assistants. For example, you can open up Facebook Messenger at breakfast and ask your weather bot what Mother Nature has in store for you that day. Then you can ask your favorite newspaper bot for the latest sports or business headlines. Planning a trip? Message a travel bot for flights and hotel recommendations, to rent a car, and more. Bots use AI technology to understand your question, find the right response, and deliver it in as conversational and “human” a way as possible,” wrote Rob Mathison for Hootsuite.
Learn how to use to perfection Facebook ads. Even the advertising politics are in a continuous change, mastering your ads’ strategy is the way to reach the best your target.
LinkedIn Website Demographics: Important Information for Marketers
Since July, LinkedIn is offering companies a way to get better information about who is visiting their web pages. That information—about the person’s job title, company, industry type, and location—could help companies better target their marketing campaigns going forward.
Businesses using LinkedIn’s Campaign Manager advertising service can use the new Linkedin Website Demographics tool to track this information, provided they insert a LinkedIn tag on the pages they want to monitor. “They can then compare how different pages do with different demographic groups and use that data to fine tune their marketing going forward. For a company that wants to hire a person with certain skills in a particular industry, this could be helpful rather than the traditional broader “spray and pray” type of campaigns,”writes Fortune.
Once you set up your website audience in Campaign Manager for website retargeting or website demographics, your audience pool will begin to build. If your website audience does not verify in 24 hours, do double check your website audience URL to make sure it has been correctly entered and that an Insight Tag has been properly placed on the pages you would like to track. Once the website audience is verified, it may take up to 90 days to build up an audience pool, depending on the volume of website traffic that meets the specific target criteria you set.
You can check the status of your website segments on the management page by moving your cursor over the Account Assets tab in the top navigation bar of your Campaign Manager account page and selecting Matched Audiences from the dropdown.
5 Free Instagram Analytics Tools for Marketers
Finding the right strategy that will for sure help your brand is not an easy task. The right Instagram tools can provide analytics to inform your social media strategy and content scheduling. If you are looking for some free tools to help your business on Instagram, we have 5 ideas that would come in handy.
Instagram Insights
If you’ve set up your Instagram business account, you have access to free analytics through the Instagram app. Instagram Insights provides basic stats for assessing your Instagram marketing efforts. Find out more about your followers, when they’re on Instagram, and what your top posts are. This information will help you choose content more likely to resonate with your audience.
To access these insights, tap the bar chart icon in the top-right corner of the app. The first analytics screen shows high-level insights for the last week and comparison stats for the week before. You can view your total impressions, reach, profile views, and website clicks. It also shows your top posts and stats for your Instagram stories from the last 24 hours. Swipe to the right to see your reach. Swipe right one more time to see website clicks data.
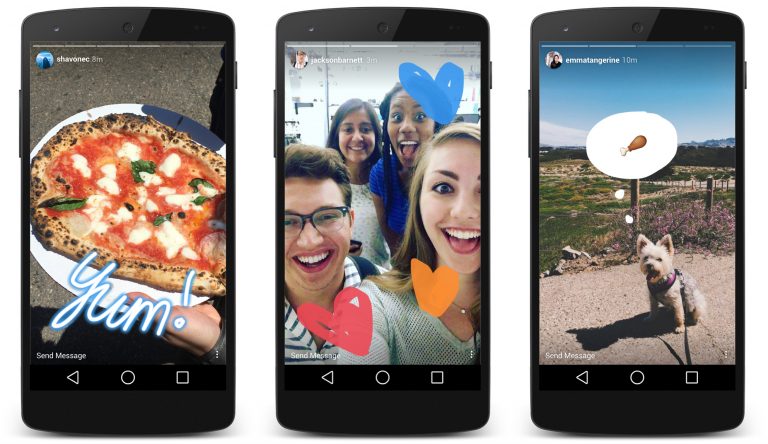
source: TechCrunch
You can also view your top posts insights, just by tapping the see more link next to top posts and the top six posts from the past seven days sorted by impressions. The tool also allows you to see followers insights. Back on the main Insights page for your account, scroll down to the Followers chart of times when your followers are on Instagram. Also, if you’re running paid Instagram ads, the Promotions section of the main Insights screen gives you relevant stats on your campaigns.
Socialbakers
With Socialbakers, you can get a free report on your most popular Instagram photos, filters, and hashtags, and all of your interactions with followers. The most useful sections are the most liked and most commented posts because this information can help inform the types of images you use in future Instagram posts.
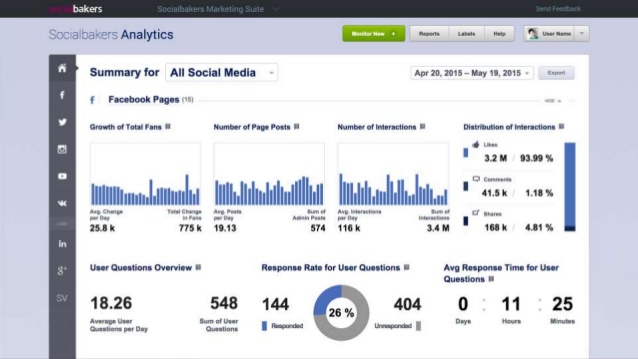
To get your free report, go to Socialbakers’ Free Instagram Analytics Tool and click Login With Instagram.
Simply Measured
Simply Measured offers a free Instagram report for users with up to 25,000 followers. The stats and insights are presented clearly and will help inform your Instagram posting strategy. The report lets you quickly see what has worked well in your Instagram marketing, so you can apply these insights to future posts. To get started, type your Instagram account name in the text box and click Authenticate With Any Instagram Account. Then log in and authorize Simply Measured to access information from your Instagram account. When you receive your report, you’ll find three tabs of information: Charts, Scorecard, and Appendix. The buttons in the top-right corner of the screen let you download the report to Excel or export it to PowerPoint.
On the Charts tab, you can view a wealth of insights about your most engaging posts and average engagement per post. Moreover, the Engagement chart shows Instagram engagement over time. See total engagement, engagement as a percentage of followers, and information on likes and comments your photos and videos received.
You can also examine the Scorecard (it gives you some basic stats about your Instagram account) and Appendix Tabs (check out a table of your top posts sorted by highest engagement with the date of the post, type, likes, comments, and total engagement – likes and comments).
It offers a free Instagram account checkup to assess how you’re doing on the network. While the report isn’t as comprehensive as some others, it offers handy nuggets of data for marketers. It helps you determine the best time to post, which hashtags to use, and what content to post more (or less) of. It also highlights your top followers and reminds you to engage with them. To access your free report, click Start Your Checkup on the home page and then sign up for a Union Metrics account.
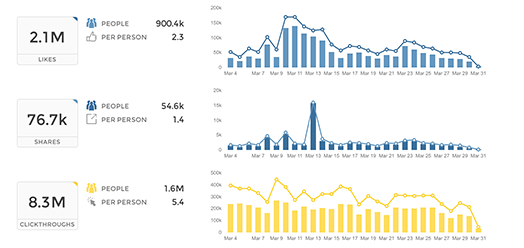
You can view the number of posts by day. Use the icons in the top-right corner of the page to share, print, or download your report. Scroll down to examine more stats with recommendations from Union Metrics, such as the best time and day to post. You can also view stats and visuals for your top-performing posts. If you click the circles on the hashtag report, you can see more information about the hashtags, which is a handy feature.
Squarelovin
With Squarelovin, you can get free basic Instagram analytics. The Optimization section offers insights that help inform Instagram posting. The “worst times to post” information is especially valuable. First, you’ll need to sign up for a Squarelovin account. On your dashboard, you can view high-level stats and access additional analytics screens. On the Postings tab, you’ll get information on your post history and top posts. It also shows your posts by year and month and day and time. The Engagement tab shows information on likes and comments, and highlights the top liked and top commented posts. The Optimization tab shows the best time and day to post on Instagram, but also the worst times to post on specific days.
If you use different filters on Instagram, you can also view the impact of those filters. Moreover, the report lets you see all of the Instagram hashtags you’ve used next to a list of the most popular hashtags. You can quickly see if you’re using top hashtags or if you need to rethink your hashtag strategy.
Understanding whom your Instagram fans are and what content they engage with and when will give you ideas for future content to share on the network.
