


Video On Demand and Its Impact On the TV
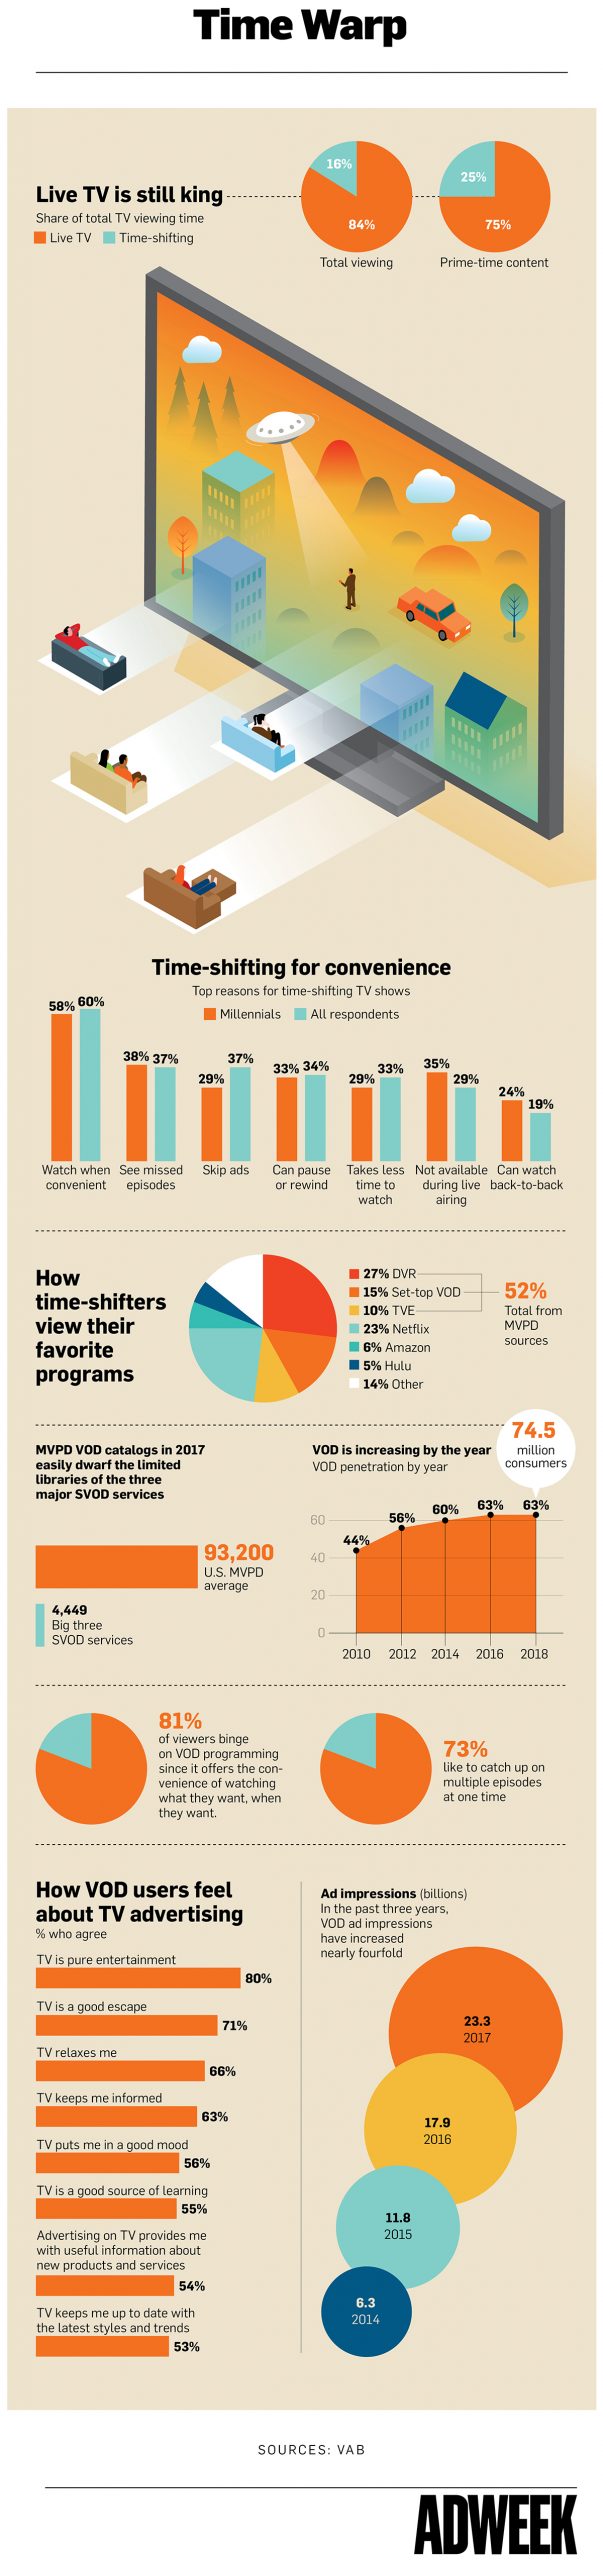
The most recent research from the Video Advertising Bureau (VAB) shows that live TV is still king, with the majority of viewers watching their favorite programs live, rather than time-shifting, or watching them after they’ve already aired. According to AdWeek, the report also found that 81 percent of viewers who binge video-on-demand (VOD) programming say they can view it at a time that is convenient for them. As a result, VOD ad impressions increased nearly fourfold, to 23.3 billion in 2017 from 6.3 billion in 2014.
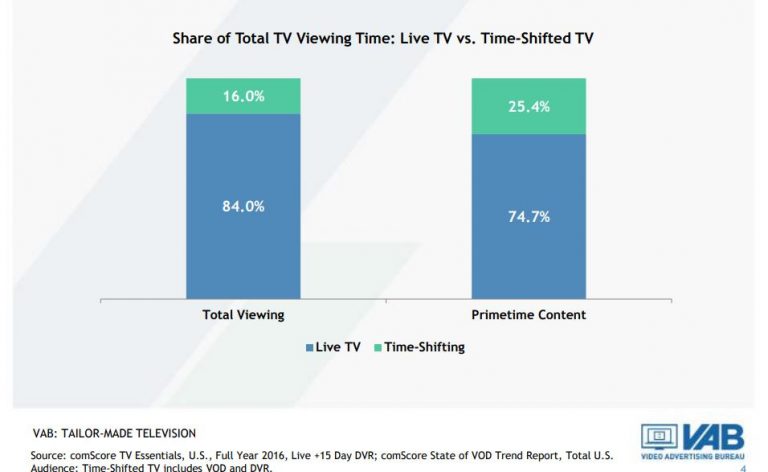
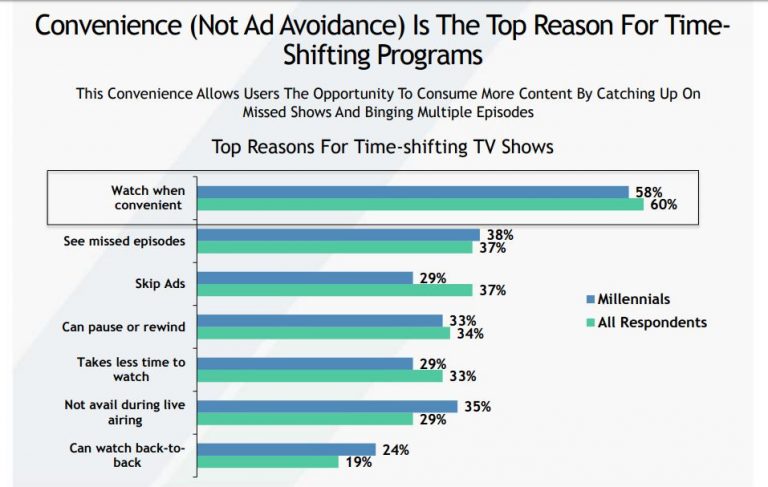
“While live TV remains the first choice for TV viewing regardless of time of day, it’s clear consumers enjoy custom designing their viewing experience to access more content, catch up on missed episodes and binge-watch at their convenience,” said Sean Cunningham, president and CEO, VAB,quoted by AdWeek. “[The research proves] TV isn’t going away—it’s everywhere.”
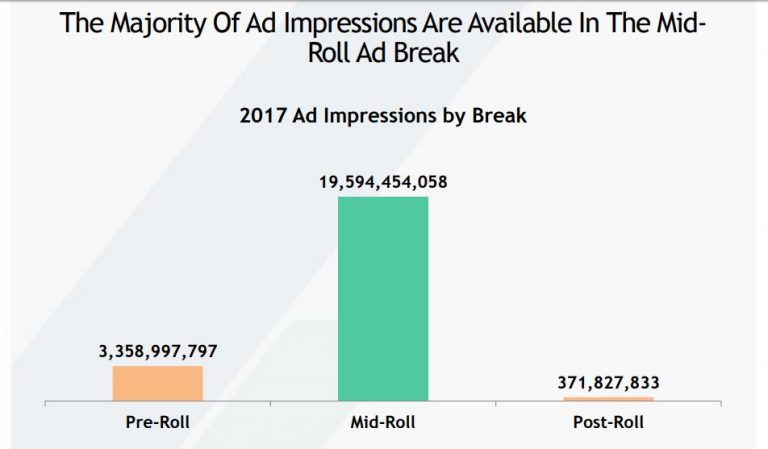
Slides’ source: VAB
Net neutrality 2018 – where does it go?
The U.S. Federal Communications Commission voted along party lines on Thursday to repeal landmark 2015 rules aimed at ensuring a free and open internet, setting up a court fight over a move that could recast the digital landscape, reported Reuters.
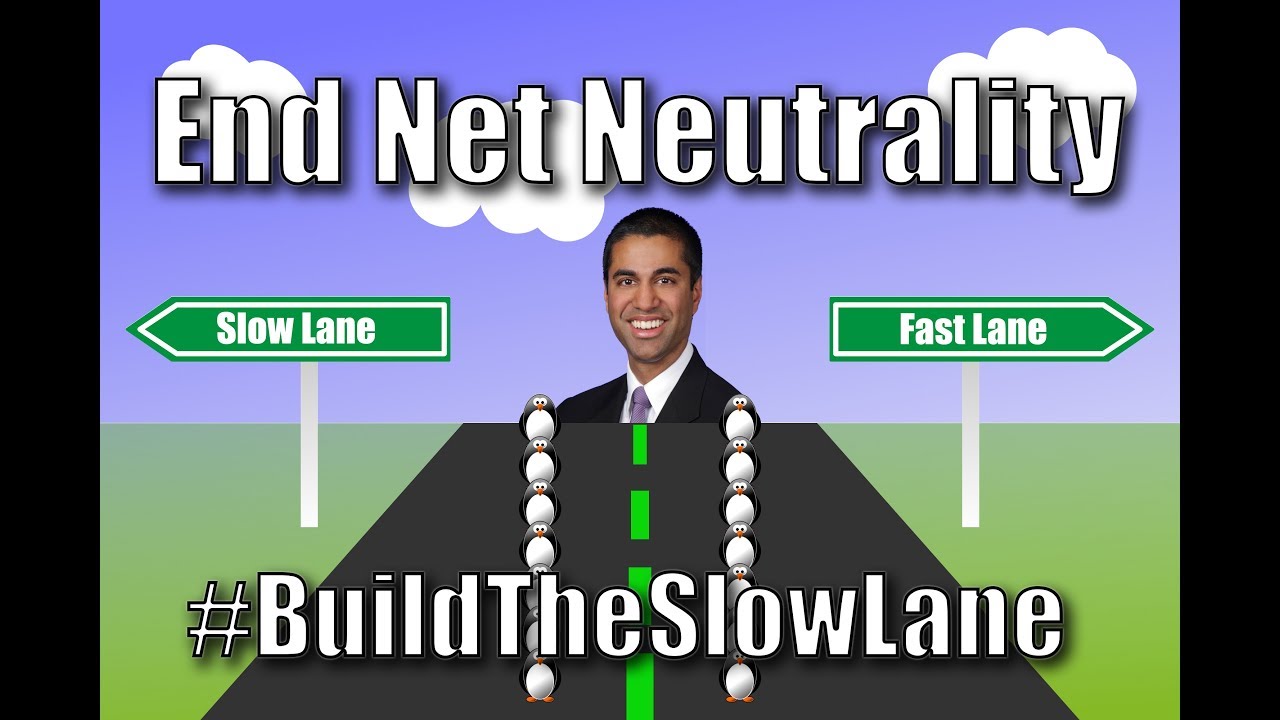
“The approval of FCC Chairman Ajit Pai’s proposal in a 3-2 vote marked a victory for internet service providers such as AT&T Inc, Comcast Corp and Verizon Communications Inc and hands them power over what content consumers can access. It also is the biggest win for Pai in his sweeping effort to undo many telecommunications regulations since taking over at the agency in January. Democrats, Hollywood and companies such as Google parent Alphabet Inc and Facebook Inc had urged Pai, a Republican appointed by U.S. President Donald Trump, to keep the Obama-era rules barring service providers from blocking, slowing access to or charging more for certain content. The new rules give internet service providers sweeping powers to change how consumers access the internet but must have new transparency requirements that will require them to disclose any changes to consumers,” commented David Shepardon for Reuters.
What can this mean in the near future? Even the consumers will probably don’t see immediate changes, it is reported that smaller startups worry the lack of restrictions could drive up costs or lead to their content being blocked.
This vote will negatively impact small- and medium-sized Internet business, and has the potential to decrease jobs and economic growth system-wide,” said Christian Dawson, executive director of i2Coalition, which includes Amazon and Google, quoted by USA Today.

“The scrapping of the Obama administration’s rules is likely to set up a court battle and could redraw the digital landscape, with internet service providers possibly revising how Americans view online content. The providers could use new authority to limit or slow some websites or offer “fast lanes” for certain content. Republicans on the FCC have sought to reassure young people that their ability to access the internet will not change after the rules take effect. People who favor the move argue that after users realize that little or nothing has changed in their internet access, it will not resonate as a political issue,” writes Fortune.
Meanwhile, in Europe….

According to Conversation, in the UK, “net neutrality is currently protected by EU policy 2015-2120 in support of a Digital Single Market – Brexit fallout aside. Potentially, after Brexit, the UK government could choose to revoke this policy, although this is unlikely because it has already committed to a Universal Service Obligation (USO), effectively making broadband access a legal requirement, as it has been in Finland for many years. Additionally, ISPs are held to account by the UK communications regulator OFCOM, which is tasked with ensuring fair play and protecting consumers from poor service. There has been widespread criticism that OFCOM has been slow and ineffective in persuading big players such as BT/Openreach to act responsibly in the past, though it has made progress recently.”
Online versus offline retail war ending soon?
“2018 will mark death of online versus offline retail war”, said Mariam Asmar, McCann London’s strategy and innovation director, for Campaign UK.
What is for certain is that both worlds willcontinue for sure to exists for a good while. In a demanding night and day economy, consumers want access to shopping at all times. They want to use price comparison sites, they want infinite choice in styles and sizes and they want to do it all from the comfort of their own home without the pressure of three different sales assistants hanging around waiting to bag some commission.
At the same time, “physical brick and mortar stores will continue to have a place in a world that still requires, and desires, human connection. The current statistic is that 90% of purchases in the UK are still made in store, while 60% of Generation Z consumers value the store experience. Millennials even want to shop in places they can touch, feel and see their product. Not to mention for some, shopping is an experience and they appreciate input and care from the staff and in store experiences,” wrote liveandbreathe.com.
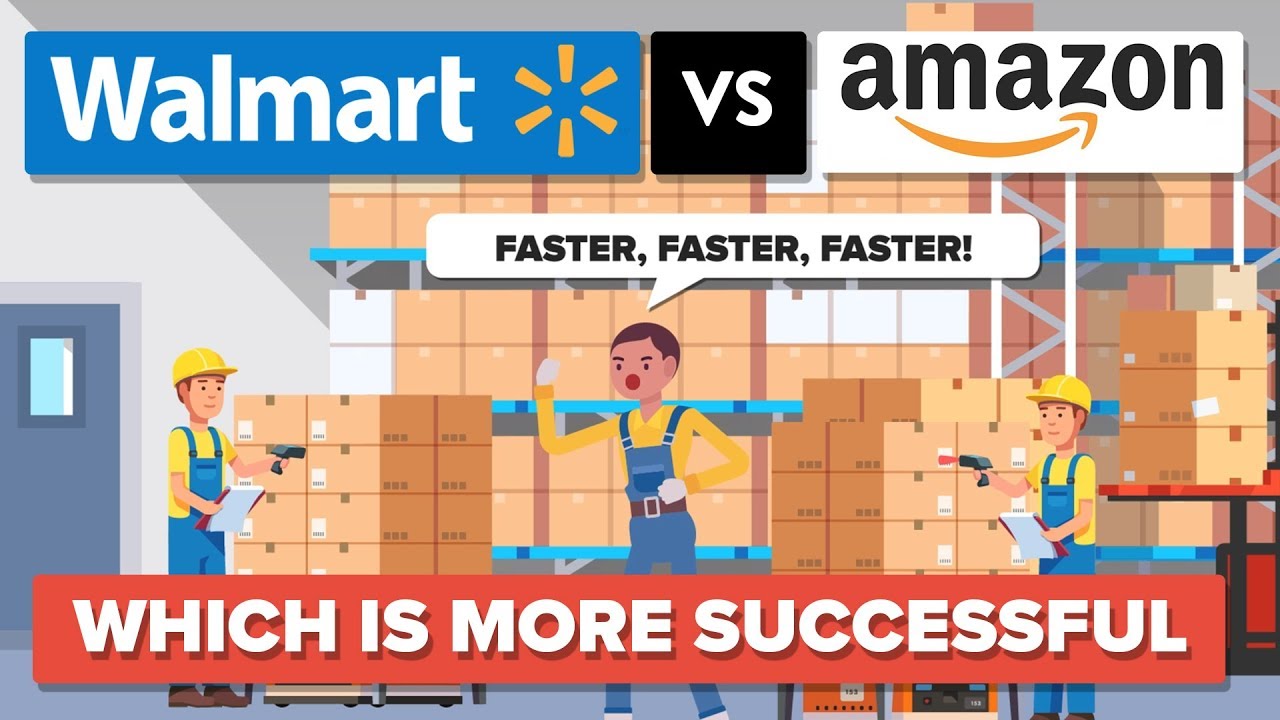
Last year, in the USA, according to “The Atlantic”, online shopping was having an offline moment, as more e-commerce companies, such as RentTheRunway and Bonobos, invested in the physical stores they once made seem obsolete. Leading the trend is Amazon, the undisputed king of online shopping, which spent $14 billion to buy Whole Foods and its nearly 500 physical locations. “According to internal documents, the company believes there is support for another 2,000 Amazon Fresh–branded grocery stores. This throwback revolution is happening in the midst of what otherwise feels like a “retail apocalypse.” Bankruptcies are rising among clothing chains, like Wet Seal, and retail icons, like Toys “R” Us, which are stuck with a glut of shopping space and squeezed between stagnating sales and large debt obligations,” wrote “The Atlantic”.
While Amazon did make a bigger splash with its $13.7 billion investment, Walmart beefed up an e-commerce stable that already includes the acquisitions of digital natives Jet.com, Shoebuy, ModCloth and Moosejaw. Collectively, these M&A deals have set Amazon, the world’s largest e-commerce company, on a direct collision with Walmart, the world’s largest retailer, to be the “everything store” in an omni-channel world — where consumers no longer distinguish between shopping online and offline.

In the future, Amazon could upgrade Whole Foods with innovative retail technologies in use at its fully automated experimental store, Amazon Go, where shoppers pick up their food and leave. There are no cashiers or checkout lines. Amazon tracks what’s taken, or put back, and charges their accounts.
Moreover, “several brick-and-mortar companies with large footprints are struggling while e-commerce companies that once launched pop-ups as mere marketing tools have realized the value of storefronts,”considers The Atlantic. For instance Amazon sees a growth in online shopping in regions where it’s opened a physical store, according to CNBC. “Five years from now, we won’t be debating whether ‘e-tailers’ are taking share from ‘brick & mortar retailers,’” Citi Research analysts recently wrote, “because they are all the same.” The trend even comes with an inevitable, and regrettable, catchphrase: “bricks and clicks.”
“Among the nation’s top 300 malls, brick-and-mortar space occupied by retailers that started online has grown by approximately 1,000 percent since 2012, according to the real-estate data company CoStar Group. While they currently account for a minuscule part of mall volume, landlords increasingly consider them critical to attracting Millennials to these malls in the first place,” adds “The Atlantic”.
In India, another big and important country, according to blog.markgrowth.com, “the FMCG is vertical: 90% of sales happen via mom and pop stores (Kirana) which are plenty in number. The remaining 10% of sales is accounted for by Modern Trade outlets ( Large Retail format stores similar to Walmart ) and the online channel. Now, these mom and pop stores are not going to go anywhere ( Over 10 million outlets in every nook and corner of the country!). Technology will aid these stores in the near future which will arm retailers with data regarding consumption patterns for instance, which will prevent stock-outs leading to an enhanced experience on the whole.”
More about the e-commerce in India and the classic retail industry one can read here and here.
Meanwhile, in China, according to www.scmp.com, malls are starting their own digital stores as they hitch their bandwagon to the concept of “new retail” pioneered by the Alibaba Holding Group chairman, Jack Ma Yun. The “online-offline integrated experience” is increasingly being used by Chinese retail property operators, who see it as a critical way of gaining insight into consumers’ shopping patterns and responding to these quickly.
The digital out-of-home advertising is already blooming
The share of global advertising spend going to out-of-home (OOH) advertising remains stable at 6 percent, shows ‘Why Out Of Home Performs’, a joint study by Magna Intelligence and Rapport, IPG Mediabrand’s out-of-home agency, into OOH’s continued growth and impact. The report was based on findings from an analysis of the global OOH industry and OOH advertising in 70 countries. This is largely down to major investment in digital OOH (or DOOH), which is growing in every environment and has seen unit numbers jump 70,000 to 300,000 worldwide in two years, and revenue increase by 30 percent.
Digital OOH is boosting advertising revenues by creating more opportunities for marketers in premium locations like airports or malls, thus increasing the revenue per panel multiple times. Although digital units account for only 5% of the global OOH inventory, they already generate 14% of total advertising revenues. In fact, DOOH already accounts for 30% of revenues in some markets like the UK and Australia, and the global share is predicted to grow to 24% globally by 2021.
“With the explosive growth of digital-out-of-home (DOOH), the diversified lifestyle touch points it reaches, and the veritable mountain of mobile driven audience data, we are best positioned to accurately, and in real-time, track audiences and deliver contextually relevant messages through out-of-home media. OOH’s sustained growth on a global scale will further enable us to create engaging consumer experiences,” said Mike Cooper, Global CEO Rapport.
source: Campaign Asia
“The digital-out-of-home market is a return to advertising’s roots, quietly shifting the industry by way of re-imagining the classic advertising experience. Nearly $4.5 billion is expected to be spent on DOOH advertising in the U.S. by 2019, an increase of approximately $1.2 billion from 2016. Zenith forecasts that DOOH will grow faster globally than all other buying methods, and PricewaterhouseCoopers predicts that DOOH advertising revenues will overtake traditional media spend in 2020, growing at a rate of 15% a year for the next four years,” writes AdAge.com.
According to MAGNA, OOH advertising is now a $29 billion market, responsible for approximately 6% of the $500 billion global advertising spending. However, OOH market share increases to 10% to 12% in some countries, including France and Russia, compared with other media categories including Internet, TV, print and radio. OOH market share has remained stable in the last five years, hovering around 6%. However, as part of its increasing importance in the media mix, OOH market share has increased from 8% to 10% of traditional media advertising spend, which includes TV, print, radio and out-of-home, among other categories.
MAGNA Intelligence, in partnership with Rapport, conducted an in-depth survey in 22 key markets including Argentina, Australia, Belgium, Canada, China, Denmark, France, Germany, India, Italy, Japan, Malaysia, Mexico, Netherlands, Norway, Philippines, Russia, Singapore, Spain, Thailand, United Kingdom and the United States. The objective of the survey was to assess OOH advertising’s sustained growth and impact during a period where offline marketing budgets are stagnating and other media categories are struggling.
Moreover, MAGNA showed in another study launched in June, that in the USA, Out-of-Home (OOH) advertising is expected to grow +2% to $7.9 billion in 2017, including cinema. MAGNA reduces its 2017 growth forecast following weak first quarter advertising sales, which grew by just +0.3% in a sudden slowdown, as seven of the last eight quarters had shown year-over-year growth of +3% or more. The 1Q17 stagnation occurred as a result of several key verticals reducing spend, including both automotive and food & beverage, which both experienced double-digit declines. This offset the continued growth from tech brands (e.g. Google, Apple, Hulu and Netflix) that have driven OOH sales over the last two years.

The DOOH market encapsulates everything from digital billboards to screens in elevators to screens on jukeboxes. Unlike internet or mobile advertising, it allows advertisers to reach target audiences in a specific, real-world context. Instead of interrupting an internet user’s online experience with an ad, it’s focused on marketing to consumers when they are “on the go” in public places or in transit. Due to its specifications, the technology has the opportunity to give to its target the message in a format that’s automated, dynamic and interactive.
“The DOOH space presents a major opportunity for creatives, technologists and consumers alike. We see DOOH’s effectiveness in the numbers: the 2016 Nielsen OOH ad study found 91% of U.S. residents age 16 or older, who have traveled in a vehicle in the past month, noticed some form of OOH, and 79% noticed OOH in the past week. The same Nielsen digital billboards study found 71% of digital billboard viewers find those ads to stand out more than online ads. Ultimately, the emerging digital-out-of-home market is groundbreaking in its interactive technology, but it’s also a return to advertising’s roots and the original purpose around advertising: to provide an engaging and useful service to the public,” writes AdAge.
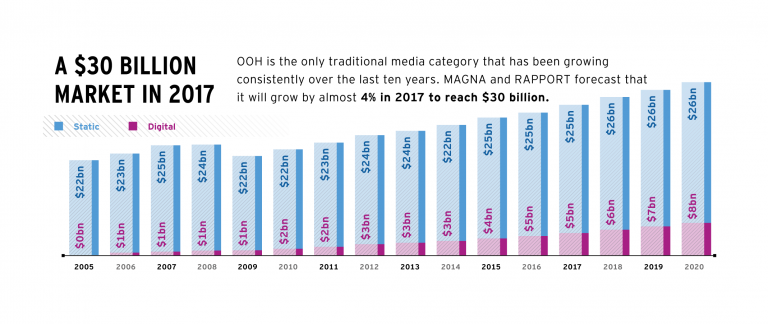
Globally, in 2016, the OOH market was worth $28 billion in net advertising, according to Magna’s report, and is predicted to grow by 4 percent per year to reach $33 billion by 2021. Behind this growth is an ever-more concentrated supply-side market, in which the top international OOH media owners are continuing to expand their influence: the six main global vendors (in order of 2016 revenue size, JCDecaux, Clear Channel, Outfront, Lamar, Stroer and Exterior) now control almost 40 percent of the whole market. By 2021, the report predicts small, but significant changes, in the environments most used for OOH. Use of billboards, currently the top revenue-generating segment and performing particularly well in India, Russia and the US, will drop 4 percent from 45 to 41 in the next five years. Street furniture and transit, meanwhile, are due to grow, respectively, from 31 to 34 percent and from 14 to 15 percent as local authorities become more willing to partner with OOH vendors. A series of major contracts—typically over 10 years long—in big cities are also in the process of renewal, the first time this has happened in the era of DOOH and programmatic opportunities, which partly explains DOOH’s recent giant revenue leap.
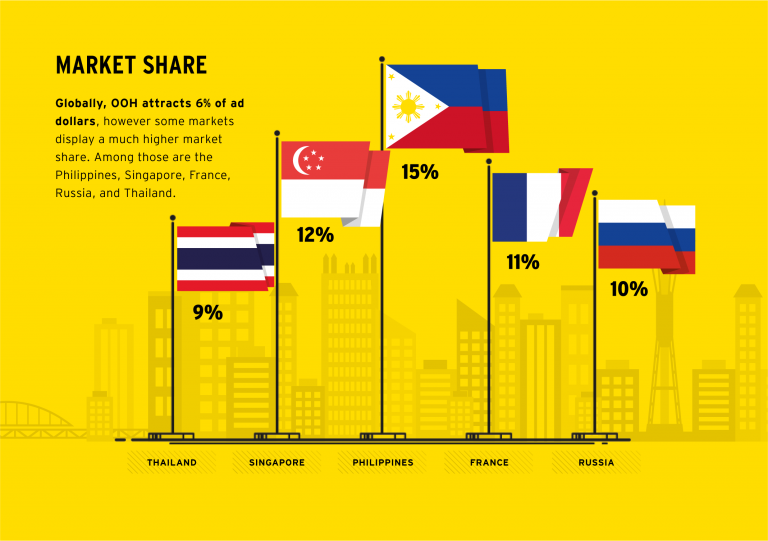
According to APAC, while the US is the largest OOH market, valued at $7.1 billion last year, APAC countries Japan ($4.7 billion) and China ($3.1 billion) come in at second and third position and per capita spending on OOH amounts to a record $38 per year in Japan, compared to $22 in the US. Singapore spends the second highest amount per capita at $36 a year. In the Philippines, meanwhile, OOH accounts for one of the highest percentage shares of overall ad spend in the world, at 15 percent compared to the global share of 6 percent. Singapore (12 percent) and Thailand (9 percent) also exceed the worldwide average.
Singapore’s OOH ads have the highest reach range of any other APAC market, with a penetration of 70 to 80 percent of the relevant population, due to its concentrated levels of urbanisation. Australia’s have the second highest, reaching 60 to 70 percent, but neither matches the reach of OOH ads in Argentina, which are considered seen by a huge 85 to 95 percent of the population.

In Australia, DOOH represents more than a third of total OOH spend, which the report attributes to a sophisticated advertising market and a population relatively concentrated in a few urban centers.
In China, the total OOH spend about matches other markets, it is one of the top five global markets in terms of penetration of digital, led by the transit segment. By 2021, MAGNA predicts that digital growth will have doubled, while OOH growth will be stagnating, partly due to lack of interest in non-digital inventory.
“OOH’s natural convergence with other digital media has hurt most other ad forms. OOH complements digital media by amplifying and enhancing it. This phenomenon has brought additional ad revenue to OOH, while most other media have experienced revenue losses as a result of the growth in digital.OOH has benefited from other new technologies, too, such as social media and mobile. Many OOH media campaigns are now picked up on social media, which greatly amplifies the total viewership. When consumers are on mobile devices, OOH is typically one of the last ad forms they’re exposed to just before important path-to-purchase decisions,” explained Steve Nicklin, Vice President of Marketing, OAAA, for billboardinsider.com.
The innovative opportunities provided by the digital platform have provided the OOH industry with new thinking and new ideas. Moreover, in the USA, as shown by the USA Touchpoints/RealityMine study, OOH and Today’s Mobile Consumer, consumers spend more time with OOH than any other form of advertising media except TV. The findings are supported by the 2016 Nielsen OOH ad study that found that 91% of US residents age 16 or older, who have traveled in a vehicle in the past month, noticed some form of OOH, and 79% have noticed OOH in the past week. Their research also discovered impressive levels of engagement, with 82% of billboard viewers reporting they look at the advertising message at least some of the time; and over one-third looking at the billboard ad each time or almost each time they noticed one. The Nielsen digital billboards study found 71% of digital billboard viewers find them to stand out more than online ads.
OOH is expanding to brand new environments. Digital screens have allowed OOH advertising vendors to penetration niche environment allowing to reach young urban population that is otherwise hard to reach by traditional media: offices, elevators, taxi, gyms, bars, retail etc. The “Digital Place-Based” segment offers targeting capabilities and programmatic opportunities. Moreover, OOH becomes addressable and experiments with programmatic. Initially developed to automate the trading of online display ads, the programmatic technologies are now being used in to buy and optimize ad campaigns on connected DOOH units.

Programmatic techniques not only optimize the workflow of media-buying but help brands deliver the right ad in the right place and at the right time, using consumer data and mobile location data. Giving advertisers the ability to plan, buy, optimize and measure the effectiveness of their outdoor campaigns through an online platform represents the natural evolution of OOH’s technology-driven transformation with many vendors developing Private Marketplaces (PMP).
Besides that, DOOH is going social. “There are two main avenues DOOH is being used to complement social campaigns, either through integration or through content creation,” says Neil Morris, founder and CEO of UK-based creative production house Grand Visual.
Mobile advertising to pass the $100 billion mark for the first time
Digital media has now surpassed linear television to become the No.1 category in advertising revenues. Within digital, the majority of advertising sales (54%) is now generated by impressions and clicks on mobile devices. The data are gathered from Magna Advertising’s Spring Forecast, June 2017. Globally, media owners advertising revenues are projected to grow by +3.7% in 2017, to $504 billion. This is a noticeable drop compared to 2016 which displayed a record +5.9% growth rate. Global advertising growth is expected to re-accelerate to +4.5% in 2018, with the return of even-year events (Football World Cup in Russia, Mid-Term U.S. elections, Winter Olympics in South Korea).

Online advertising sales will grow by 14% this year while offline ad sales (television, print, radio, out-of-home) will decrease by -2% (last year was flat), but it will pass the $200 billion mark ($204 billion) to become the #1 category globally, with 40% of total ad sales vs 36% for television. Within digital, the majority of advertising sales (54%) is now generated by impressions and clicks on mobile devices.
The star of these years, the mobile advertising will be passing the $100 billion mark for the first time this year ($110bn), while the video and social formats will continue to drive digital advertising growth (+30% or more) with paid search growing double digits again (+13%) to remain the number one format (almost half of digital ad sales). The two digital-native advertising formats or environments (search and social) now represent a combined 70% of total digital ad spend and will capture 85% of the net growth this year. For the second year in a row, social video formats (counted as “social” by MAGNA) will represent a major driver to digital spend, attracting major consumer brands in the social environment where, until recently, there was not significant spend in this category.

While this is slower than last year’s 51.6% mobile growth rate, it represents $27 billion of incremental mobile advertising spend, which is in line with last year’s $28 billion of incremental mobile spend. Mobile isn’t losing any momentum; growth rates are only declining because of the increasing base of mobile advertising spend. This strong growth contrasts with desktop growth, which is expected to shrink by -2.2% this year. This is the second consecutive year of negative desktop advertising growth, and it is expected to continue to decline for the foreseeable future. Within digital, search advertising is by far the largest portion of spend; search is expected to grow by 13% this year to reach $99 billion, or just under half of total digital advertising budgets. This growth represents 30% mobile search growth, and desktop search shrinking by -3%. Mobile search advertising has passed the halfway point to become the majority of search advertising spend, with 55% total share expected this year. Furthermore, the incremental $11 billion of search advertising spend represents over 40% of total incremental digital dollars. Search has been especially strong because of both continued new product innovations such as search re-marketing and customer match lists, along with the growth of non-core search such as Alibaba product listings. Furthermore, search advertising continues to be strong because of its position in the advertising funnel and the ease with which search activity can be connected to customer behavior and sales. Looking forward, search advertising will remain robust, growing around 10% annually to reach $140 billion by 2021. At that point, it will be larger than newspaper, magazines, radio, and OOH combined.

Equally important within digital advertising is social media, which is expected to grow by +32% this year to reach $42 billion, slightly ahead of prior expectations for +29% growth. Social advertising is the fastest growing portion of digital spend, and like search, this is because of mobile platforms. 85% of total social advertising dollars are coming from mobile devices, the highest share of any digital sub-format. Furthermore, social’s 31.6% growth rate represents $10 billion of incremental spend. This is nearly as much as can be found in search advertising despite social being less than half the total size. Growth comes both 10/17 from increased social usage and penetration, as well as new product innovations, including social video, and increasingly dense ad loads on social media. Looking forward, mobile advertising will continue to be dominant in social: by 2021 it will represent 93% of total social media sales. Impressively, search and social combine to represent more than the total of incremental dollars across all media formats (offline media and shrinking digital formats like banner display are net losers; search and social are the growth engine for global ad spend). Video advertising is growing nearly as quickly as social media; growth this year is expected to be 30%, which will bring total video advertising spend to $23 billion. While desktop video is still showing growth at +14% (unlike most other desktop formats), the engine for online video ad spend growth is mobile (+56% growth expected to bring mobile share of video spend to +45% this year). Mobile video will match desktop next year as the mobile video experience, wireless broadband penetration, and mobile video content continues to improve. By 2021, online video advertising will have passed the $50 billion mark globally, and digital video will represent more than 20% of total video viewing (TV and online video). Banner display and other digital advertising formats (email advertising, online classifieds etc.) are stagnating, with both expected to shrink by around -3% this year. Not only have brands found better outcomes using other digital formats such as search, social, and video, but display inventory is also on the decline. Standard banner online real estate is being replaced by video and other rich media formats.

“The record level of growth in 2016 globally, outperforming economic growth, was caused by marketers willing to embrace the new opportunities offered by digital media (search, social, video, programmatic) on a larger scale, while anxious to preserve their share of voice on traditional linear television, despite rising CPMs costs. In 2017, both digital and offline growth will slow down. Online advertising sales will nevertheless continue to grow by double-digits in most markets (globally +13%), but television ad sales will decline (-1%) due to softer price increases, ratings erosion and the lack of global sports events,” declared Vincent Létang, EVP, Global Market Intelligence at MAGNA and author of the report.
In the UK, online advertising sales will grow by an average 10% through the region, to $42 billion. Digital advertising now represents almost 42% of total advertising in Western Europe, slightly above the global average (40%). The fastest-growing formats will be social media (+37%) and video (+19%) while paid search spending will grow by 10%. Ad revenues from static banners will decrease by 5%. In terms of platform, mobile will capture all the growth (+36% to $19 billion). Mobile ad sales will represent 43% of internet ad sales by the end of 2017, which is slightly below the global average or APAC average.
Batteries, solar panels and the end of fossil fuels
A study published in January in the Journal of Sustainable Finance & Investment predicts that the combination of battery storage with renewable energy will make fossil fuels increasingly obsolete. The driving forces of this disruption include the “decline in retail renewable electricity prices,” along with plummeting costs of batteries. Fossil fuels are the most widely used source of energy because of base load power, which means they provide energy at all times, night and day. In contrast, renewables have faced the ‘intermittency’ challenge—the sun doesn’t always shine, and the wind doesn’t always blow.
But authors Jemma Green and Peter Newman of Curtin University in Australia show that as storage gets cheaper, renewables will become more competitive with fossil fuels on costs and reliability. By 2050, these irresistible technological and market forces could make oil, gas and coal seem too costly and cumbersome, leading renewables to account for “100 percent of global energy demand.”
![]()
source: energyathaas.com
According to Vicente Lopez-Ibor Mayor, chairman of Lightsource—the biggest solar energy company in Europe—there will be an immediate impact within just three years. Moreover, Mayor told Motherboard that the speed of technological improvement means solar storage is “going to be massively disruptive to the business-as-usual processes of oil, gas and coal.”
In three years, he said, it will “begin to transform” the electricity infrastructure of major cities. “Solar storage is pitched to become so cheap it will make relying on natural gas peaker plants pointless…It will lead to rapid adoption of solar by businesses, local governments, and households—not because people are environmentally conscious, but simply because it will make more economic sense.”
More on their approach you can read here.
The Powerwall system
While wind and solar power have made great strides in recent years, with renewables now accounting for 22% of electric energy generated, the issue that has held them back has been their transience. But now, the renewable power billionaire Elon Musk has just blown away that final defence. In an event held in California he introduced to the world his sleek new Powerwall – a wall-mounted energy storage unit that can hold 10 kilowatt hours of electric energy, and deliver it at an average of 2 kilowatts, all for US 3,500. That represents an electricity price (taking into account installation costs and inverters) of around US 500 per kWh – less than half current costs, as estimated by Deutsche Bank.
“That translates into delivered energy at around 6 cents per kWh for the householder, meaning that a domestic system plus storage would still come out ahead of coal-fired power delivered through the conventional grid,” explains iflscience.com.
Moreover, the reality is much closer than we might think as Musk is going to manufacture the batteries in the United States, at the “gigafactory” he is building just over the border from California in Nevada. And that while not staying and waiting for some totally new technology, but scaling up the tried and tested lithium-ion battery that he is already using for his electric vehicles.
The Powerwall system offering 10 kWh is targeted at domestic users. It is complemented by a commercial system termed the Powerpack offering 100 kWh storage, and a stack of 100 such units to form a 10 megawatt hour storage unit that can be used at the scale of small electricity grids. Whole communities could build micro-grid power supply systems around such a 10 MWh energy storage system, fed by renewable energy generation (wind power or rooftop solar power), at costs that just became super-competitive.

More than that, Musk declared that the entire electric power grid of the US could be replicated with just 160 million of these utility-scale energy storage units. And two billion of the utility-scale units could provide storage of 20 trillion kWh – electric power for the world.
Solar panels have repaid their fossil fuel debt
At the same time, another study says that thanks to the growing solar power capacity around the world, solar power has reached the break even point. The study from the Netherlands, published in Nature Communications, says that the power generated by solar photovoltaic panels over the last 40 years has offset the polluting energy used to produce them.
By the researchers’ calculations, for every doubling of global solar power capacity, the energy used to produce them fell by 12-13 percent and greenhouse gas emissions fell by 17-24 percent, depending on what material was used. Solar capacity has grown roughly 45 percent a year since 1975, reaching 230 gigawatts (GW) in 2015. By the end of 2016, there could be 300 GW installed.

“The researchers believe the break even point was likely hit about five years ago for both energy consumed and emissions meaning, at this point, global solar energy is having a net positive impact and will continue to increase that positive impact going forward. This feels like a major cause for celebration. If you’re a homeowner with solar panels, the researchers say that individual solar panels repay their fossil fuel debt several times over during their average 30-year lifespan,” wrote Megan Treacy for treehugger.com.