


Best 8 goal-tracking apps to help you achieve your objectives
1. Adidas Running – Sports, Fitness & Run tracker
With over 50 million downloads, the Adidas Running app is a GPS and workout tracker for running beginners, 5k and marathon training.
Users can map their runs and track minutes, miles and calories burned for over 120 activities.
The app invites users to take part in challenges and virtual races to keep them on their toes and keep the competitive spirit alive.
Users can also create their own fitness community to motivate them and push them forward when they follow other users.
The app has built-in GPS tracking so that users have all their workout statistics and progress in one place and allows users to score activity so they record when they reach a new personal best.
Adidas Running has a powerful goal-setting feature that supports any goals the users set, whether it’s distance, duration or weight loss and allows them to choose a daily, weekly, monthly or yearly goal. A newly-added statistics section prompts users to compare their performance from the past weeks, months and years.
What the users like about Adidas Running:
![]() Live tracking voiceover,
Live tracking voiceover,
![]() Satellite imagery of the route and the stats, graphs and charts,
Satellite imagery of the route and the stats, graphs and charts,
![]() Prompt customer service,
Prompt customer service,
![]() Accurate data imports
Accurate data imports
![]() Helpful and interesting articles on the blog
Helpful and interesting articles on the blog
![]() Reliable and easy to use
Reliable and easy to use
![]() Great for running and cycling
Great for running and cycling
2. Fabulous: Daily motivation & habit tracker
Fabulous is a gentle coaching tool to help users build routines to become their best self.
Incubated at Duke University Behavioral Economics Lab, Fabulous was nominated for Google Play’s Best App Award and won Google’s Material Design Award for Most Charming Engagement.
The app’s ultimate goal is to instil habits that improve users’ health.
Fabulous is a science-based app that will motivate users to improve their fitness and achieve their weight loss goals. It also is a great helper for sleep cycle reboot and anxiety reducing mindfulness.
Users are nurtured to learn to build a transformative morning routine and even pick up life-changing habits like meditation and yoga.
Unlike other goal-tracking apps, Fabulous steps into the role of a life coach, building motivation so users can focus on developing habits that reduce the level of anxiety and improve daily productivity.
What users like about Fabulous:
![]() Imagery and sound effects
Imagery and sound effects
![]() Quick and easy to use
Quick and easy to use
![]() Easily incorporated into the flow of your day without feeling annoyed or distracted
Easily incorporated into the flow of your day without feeling annoyed or distracted
![]() Lays out the plan for users
Lays out the plan for users
![]() Doesn’t feel regimented
Doesn’t feel regimented
![]() Holistic, incorporating body, mind and soul
Holistic, incorporating body, mind and soul
![]() Customizable
Customizable
3. Todoist: To-Do list, tasks & reminders
Online magazine The Verge named Todoist “the best to-do list app right now” and it was Google’s selection for 2020 Editor’s Choice.
With Todoist, users can capture and organize tasks the moment they pop into their head.
Having trouble remembering deadlines?
Todoist helps you with that by sending you reminders and due dates.
Users can build lasting habits with recurring due dated. They can collaborate on projects by assigning tasks to others and prioritize tasks with priority levels.
The app allows users to track their progress with personalized productivity trends.
Todoist also integrates with other tools like Gmail, Google Calendar, Slack, Amazon Alexa and more.
What users like about Todoist:
![]() Automatically schedules tasks
Automatically schedules tasks
![]() Excellent app on both mobile and desktop
Excellent app on both mobile and desktop
![]() Intuitive interface
Intuitive interface
![]() Quick and easy to structure
Quick and easy to structure
![]() Ability to divide tasks by project
Ability to divide tasks by project
![]() Ability to assign priorities
Ability to assign priorities
![]() Fast
Fast
4. Daylio – Diary, Journal, Mood tracker
Daylio is a self-care bullet journal with goals. The app enables users to keep a private journal without having to type a single line.
Daylio is built on three principles:
- Reach happiness and self-improvement by being mindful of your days;
- Validate your hunches ie how your new hobby influences your life;
- Form a new habit with no learning curve.
The app allows users to create daily, weekly or monthly goals. The users can motivate themselves, build habits and collect achievements.
Daylio collects recorded moods and activities in the statistics and calendar so users can discover what makes them happy.
The app allows users to keep track of activities and create patterns to become more productive.
What users like about Daylio:
![]() A wide range of customization and options to make the app for them
A wide range of customization and options to make the app for them
![]() Notification reminders for goals
Notification reminders for goals
![]() Useful for memories
Useful for memories
![]() Great support team
Great support team
![]() High level of flexibility
High level of flexibility
![]() Aesthetically pleasing
Aesthetically pleasing
![]() Easy to use
Easy to use
![]() Great app to keep track of moods and identify problems
Great app to keep track of moods and identify problems
5. Any.do – To do list, task, reminders & planner
The Wall Street Journal named Any.do the #1 to-do list app out there and was selected google’s Editor’s Choice.
Any.do is a free to-do list, planner and calendar app for managing and organizing your daily tasks, to-do lists, notes, reminders, checklists, calendar events and more.
Users can create and set reminders with voice and add them to their to-do list.
For better productivity, the app provides users with calendar integration to keep their agenda always up to date.
Any.do integrates with a slew of tools like Google Calendar, Evernote, Wunderlist, Salesforce, Zapier and more.
The app has an intuitive drag and drop feature and a shaking feature to remove completed tasks from the user’s to-do list.
What users like about Any.do:
![]() Easy to use
Easy to use
![]() Incredibly versatile
Incredibly versatile
![]() Great customer service
Great customer service
![]() Seamless connection between multiple devices
Seamless connection between multiple devices
![]() Unique and simple features
Unique and simple features
![]() Flexibility to do planned work on time
Flexibility to do planned work on time
![]() Hierarchy for to-dos
Hierarchy for to-dos
6. Loop Habit Tracker
Loop Habit Tracker helps users create and maintain long-term positive habits.
The ad-free app provides users with detailed charts and statistics to give them a clear picture of how their habits have improved over time.
The app has an elegant and minimalistic interface that is very easy to use.
It helps users through its advanced formula for calculating the strength of their habits. Every repetition makes the user’s habit stronger.
Loop doesn’t impose limits on how many habits users can have and doesn’t require an internet connection or online account registration.
The user’s confidential data is never sent to third parties.
What users like about Loop Habit Tracker:
![]() Ease of flexibility to define goals
Ease of flexibility to define goals
![]() Data is not automatically stored in the cloud
Data is not automatically stored in the cloud
![]() No ads
No ads
![]() Makes progress visible in the most simple and informative way
Makes progress visible in the most simple and informative way
![]() Effective
Effective
![]() Very helpful in forming new habits and curbing bad ones
Very helpful in forming new habits and curbing bad ones
![]() Highly customizable
Highly customizable
![]() Easy interface that doesn’t intrude
Easy interface that doesn’t intrude
7. Habit Hub – Habit tracker and goal tracker motivation
HabitHub tracks habits, helps users accomplish their goals and rewire themselves.
The app is based on Seinfeld’s productivity tip which involves building long streaks of days. These streaks motivate users to keep moving forward.
HabitHub comes with four prebuilt themes and a full-featured calendar view for every habit to track and visualize.
The app is integrated with smartwatches allowing users to mark the days directly from the watch.
Users are prompted to make the most of the app’s flexible scheduling system which can track any habit.
Habits are also categorized according to various aspects of users’ life.
What users like about HabitHub:
![]() Intuitive design
Intuitive design
![]() Helpful and motivating without feeling oppressive or overwhelming
Helpful and motivating without feeling oppressive or overwhelming
![]() Very useful for employees working at home
Very useful for employees working at home
![]() Excellent statistics
Excellent statistics
![]() Flexibility
Flexibility
![]() It makes it very easy to keep track of multiple habits at once
It makes it very easy to keep track of multiple habits at once
![]() The rewards option
The rewards option
8. Goal Meter – Goal tracker, habit changer, to-do list
Goal Meter is a goal tracking and habit changing tool. It allows users to schedule their day in advance, increase productivity and improve efficiency.
The app allows users to improve their time management skills by breaking down goals into daily routines and habits which is suitable for anyone looking to do more in less time.
Goal Meter makes it easier for users to complete goals by allowing them to pick habit templates like Study, Exercise, Diet, Work, Health, Financial, Bad habits to stop and more.
The app is more convenient than a calendar for routine tasks as it doesn’t clutter the calendar schedule.
What users like about Goal Meter:
![]() A fun app that is great for smart goals
A fun app that is great for smart goals
![]() Great for time-bound goals
Great for time-bound goals
![]() Great app for achievers
Great app for achievers
![]() It gives users the ability to be as specific or general as possible
It gives users the ability to be as specific or general as possible
![]() It allows for psychological helpful factors like identification, stair-stepping, accountability and visualization
It allows for psychological helpful factors like identification, stair-stepping, accountability and visualization
![]() Pleasant and easy to use interface
Pleasant and easy to use interface
![]() Clicking the Done button keeps users motivated
Clicking the Done button keeps users motivated
![]() Great artwork
Great artwork
![]() Setting goals according to different measurements
Setting goals according to different measurements
Join the Conversation
We’d love to hear what you have to say.
Get in touch with us on our LinkedIn Page, Facebook Page, Twitter or TikTok.
These 13 brands use Alexa Skills to engage creatively with their consumers
Is your brand positioned toward consumers? You should consider having an Alexa skill to engage creatively with your consumers.
Why?
Because voice has changed consumer behaviour and brands need to start leveraging its power.
According to eMarketer, voice-control technology has officially moved out of the early-adopter phase and into the mainstream.
The market of voice-assistants (Alexa, Google Duplex, ….) is expanding quickly and the reason is very simple: talking to voice-assistants feels natural to people and it’s more convenient.
Voice-assistants users can multitask and get more done with less friction. Shoppers and parents are power users.
Habitual shoppers love the convenience of the shopping experience and getting things done while taking care of a child is every parent’s dream.
Discover more insights on voice including the 2019 Microsoft Voice Report in How voice is changing customer behaviour and the way you do marketing.

Let’s see how 13 brands take advantage of Alexa Skills to engage with their consumers:
1. Starbucks Reorder
Use Starbucks’ Alexa Skill to reorder your usual cup of coffee from one of the last 10 stores you’ve ordered from.
You can also check your primary Starbucks Card balance and switch between your last 5 previous orders.
2. Domino’s
With Domino’s skill, you can build a new order from scratch, place your most recent order or check your order’s status.
3. Uber

Get a reliable ride in minutes with the Uber skill.
4. Citi Entertainment

Citi Entertainment is developed by Citibank, the financial services company. Use this skill to search for thousands of live music events all over the country.
5. TED Talks

TED Talks are influential videos from expert speakers on education, business, science, technology.
With its Alexa Skill, the nonprofit organization allows users to play the latest TED talk, play random TED talks, or search for talks by topic or by speaker name. They can also play talks that are funny, inspiring, persuasive, courageous, or jaw-dropping.
6. OurGroceries

OurGroceries is a mobile app which provides users with a way to keep grocery lists instantly synchronized on all the smartphones in their household.
This skill lets users add items to the shopping lists on their app.
7. Walmart Stories
In this skill, Walmart invites consumers to discover how the organization is using innovative technologies to redefine the associate and customer experience.
8. Levi’s Assistant
With this Alexa Skill, users get answers to common questions about the jeans manufacturer’s services.
Levi’s shoppers can get help on return policy, how to use gift cards, available payment methods, and more. They can also get help on finding a pair of jeans or the nearest store, track their order and get information on the latest promotions.
9. Bed Bath & Beyond tip of the day

Bed Bath & Beyond Inc. is an American chain of domestic merchandise retail stores.
The company’s Alexa Skill provides users with a daily dose of little life-changers like genius hacks, fun facts, smart tips and expert tricks.
The skill also helps users pick the best products for their whole house, top to bottom.
10. Employment Tips by MooreSuccess Inc.
MooreSuccess is an executive recruiting firm with over 10 years of experience. In its Alexa Skill, the company offers exclusive tips and advice for job seekers from an expert human resources executive.
11. Ten Things in Tech by Business Insider

Business Insider, the financial and business news website operating internationally, developed an Alexa Skill which provides users with the biggest daily tech news.
12. Johnnie Walker
Johnnie Walker, the famous brand of Scotch whiskey goes all-in with its Alexa Skill.
The skill invites users to explore nearly two centuries of whisky knowledge with 4 different options: Choose a Label, Buy a Bottle, Whisky 101, and Try a Guided Tasting.
In “Choose a Label”, consumers can find the perfect blend for themselves or a gift through a series of questions about flavour preference and price.
If consumers are looking to simply buy a bottle of Johnnie Walker, they can choose “Buy a Bottle” and Alexa will help them find the nearest store or delivery option.
When they select “Whisky 101”, Alexa will share a random fact about Johnnie Walker or whisky in general.
In order to “Try a Guided Tasting”, consumers will need one of the core Johnnie Walker Labels on hand: Red Label, Black Label, etc. Then, Alexa will conduct a personalized tasting based on the blend they choose. As they sniff and sip their way through the tasting, she’ll give helpful tips and ways to serve.
13. Hellmann’s Best Recipes by Unilever

Hellmann’s Best Recipes by Unilever is the perfect answer when you want to cook your family a hot meal and need some culinary inspiration. Hellmann’s Alexa Skill has got you covered with a large database of delicious recipes. It’s too late to go shopping and you need to cook with whatever ingredients you have in your fridge? Hellmann’s Best Recipes can help you by providing recipe ideas for ingredients you already have on hand.
Are you planning to launch your own Alexa Skill?
Good!
To make sure you treat your consumers to a great voice-activated experience, here’s how your skill needs to be:
![]() Frictionless. Make sure your users’ experience is seamless.
Frictionless. Make sure your users’ experience is seamless.
![]() Helpful and informative. Include answers that your customers might look for: discounts, catalogue prices, return policy, work hours, the closest store, recommendations related to your product etc.
Helpful and informative. Include answers that your customers might look for: discounts, catalogue prices, return policy, work hours, the closest store, recommendations related to your product etc.
![]() No commercials. Refrain from including commercials in your skill, it’s annoying and it turns people off.
No commercials. Refrain from including commercials in your skill, it’s annoying and it turns people off.
![]() The latest. Provide your consumers with the latest news, the latest company info or products discounts. If you are providing news like the Business Insider, ensure that you upload the latest relevant news to your users.
The latest. Provide your consumers with the latest news, the latest company info or products discounts. If you are providing news like the Business Insider, ensure that you upload the latest relevant news to your users.
![]() Entertaining. If it’s aligned with your brand values and consistent with your brand voice, be entertaining.
Entertaining. If it’s aligned with your brand values and consistent with your brand voice, be entertaining.
![]() Helpful. Help users complete a task or guide them through the stages of a process (cooking a meal etc). Also, cater to your consumers’ needs even if this means not recommending your own product. Hellmann’s skill has a large database of recipes with and without mayo.
Helpful. Help users complete a task or guide them through the stages of a process (cooking a meal etc). Also, cater to your consumers’ needs even if this means not recommending your own product. Hellmann’s skill has a large database of recipes with and without mayo.
![]() Keep the conversation going. Find creative ways to keep talking to your consumers on other platforms (email, social media) and turn them into brand ambassadors.
Keep the conversation going. Find creative ways to keep talking to your consumers on other platforms (email, social media) and turn them into brand ambassadors.
Have you found this article useful?
Share it with your colleagues!
26 User Experience (UX) Design Stats for Digital Success
What is User Experience (UX) Design for Digital Success?
User Experience (UX) Design improves customer satisfaction and loyalty through the utility, ease of use, and pleasure provided in the interaction with a digital product (mobile app, website etc).
We interact with digital products a dozen times every day. From checking social media to ordering food and texting our loved ones. According to AppAnnie, the average smartphone user has more than 80 apps on their phone and uses close to 40 of them each month. If they weren’t easy to use, they wouldn’t be on your smartphone!
To help you understand how vital UX Design is to every website owner or admin and essential to every entrepreneur and business owner, I’ve put together the following list of 26 stats.
26 User Experience (UX) Design Stats for Digital Success
1. 70% of people scroll your content; only 20% scroll to the bottom.
Put your best content first.
2. Users spend 80% of their time above the fold.
Make the content above the fold engaging, eye-catching and tell them what your product or service is all about in as few words as possible. Make it concise and to the point.
3. 74% of users only see the first two screens.
Make sure the first two screens include relevant content to your website visitors.
4. It takes 0.05 seconds to form a design opinion.
That’s fast! Will your users like what they see?
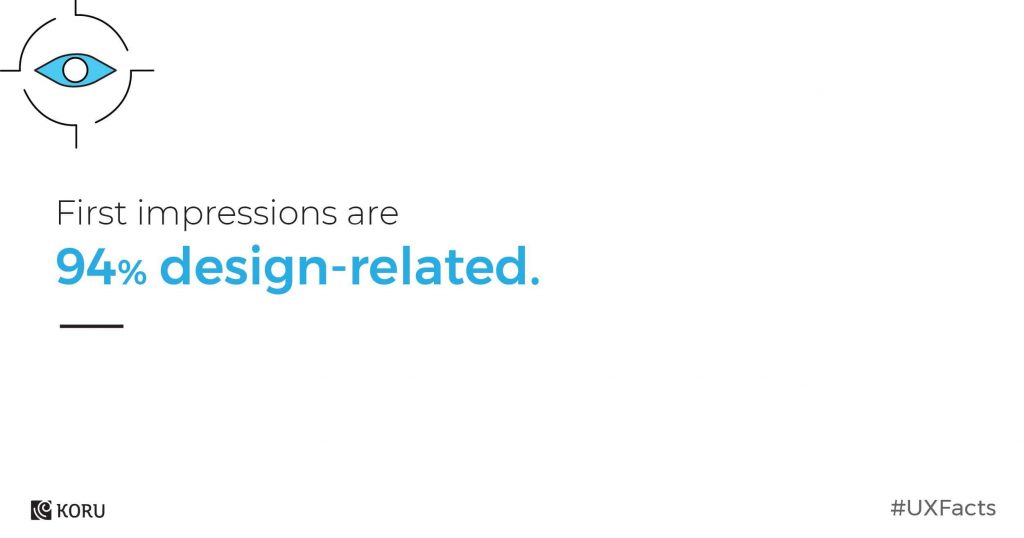
5. First impressions are 94% design-related.
As in life, you need to make a great first impression and a good design helps you achieve that.
6. 75% of users scan your content instead of reading word for word.
Yes, it took you three hours to craft your latest in-depth long-form blog post and your readers won’t read it, they will scan it. It’s true what they say: writers don’t get the appreciation they deserve. It’s sad, but there’s a solution: use sub-headlines, bullet points, lists, paragraphs etc to help your readers understand quickly what your blog post is about.
Source: uxplanet.org
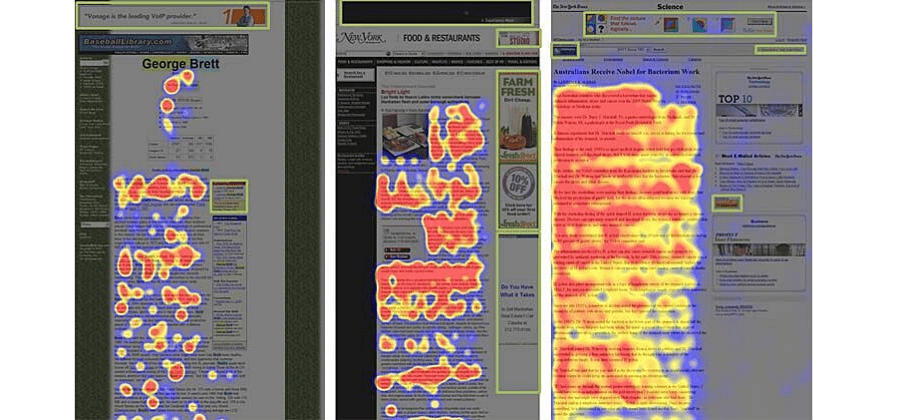
7. Users avoid looking at adverts based on their location: right-hand margin and top banner.
It’s called ad blindness and is the result of the digital ads proliferation that happened in the late 1990s. As a measure of self-protection, our brains learned to ignore these ads or any content placed in the right-hand margin and top banner. Don’t place important content there!
8. Find out how people use your product or service in the real world.
The first rule of marketing is you are not the customer. Go out and meet with your customers. Speak to them and see how they use your product in the real world.
Here are the top 5 user testing methods as recommended by Adobe:
- Usability testing where UX designers understand how real users experience your website or app.
- Focus groups help them assess user needs and feelings both before a product’s design and long after its release.
- Beta testing allows UX designer to roll out a near-complete product to individuals who are happy to try it and provide critical feedback.
- A/B testing is ideal as the appropriate testing method when designers are struggling to choose between two competing elements.
9. What is the user experience? What people feel, want, think, believe, remember, don’t realize about your product.
UX designers are critiques, artists, psychologists, behaviour analysts and architects. They think in the past, present and future.
10. Great user experience design can boost your brand, customer satisfaction and your company’s bottom line.
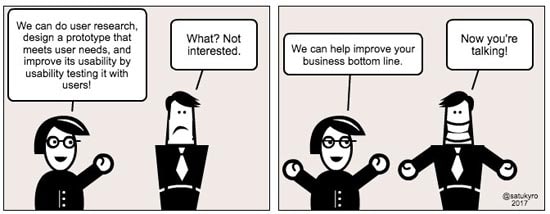
11. Above all else, user experience is about listening.
Listening is an underrated UX design tool. The goal of every UX designer is to understand the user’s needs and understand what they want. They can achieve their goal by having empathy towards users and listening is the way towards empathy.
Having the ability to step in the user’s shoes is considered a must-have skill for UX designers. It is one thing to hear the user’s problems, it is another thing to listen to the user’s problems.
Why should UX designers listen to the users? The main benefit of actively listening to the user is that UX designers have an easier time designing solutions because they know exactly what they are designing.
12. In case of confusion, sketch it out.
In case of confusion, #SKETCH IT OUT. Has sketching helped your #design process? Share with us in the comments below.#SketchThis #drawing #illustration #draw #ux #ui #uidesign #userinterface #architecture pic.twitter.com/PEEHlnmmtF
— Koru UX Design (@koru_ux) August 29, 2019
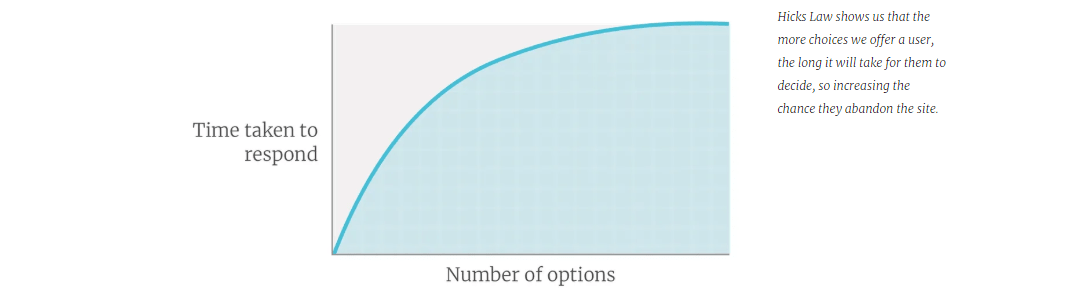
13. “You make people happier not by giving them more options but by stripping away as many as you can.” — Cliff Kuang, Wired
One would argue that having many options to choose from leads to the best decision. Actually the opposite is true. It’s called decision paralysis.
Analysis paralysis is a state of over-analyzing (or over-thinking) a situation so that a decision or action is never taken, in effect paralyzing the outcome.
Hick’s law describes the time it takes for a person to make a decision as a result of the possible choices he or she has: increasing the number of choices will increase the decision time logarithmically.
Source: boagworld.com
14. Have your website recognize holidays and special events.
Why? The first reason for a website to change its design for a holiday or special occasion is to appear up to date.
A website that doesn’t reflect what’s currently topical and important will feel out of touch. Worse, it will seem stale and people may think that it is outdated in other respects as well.
The second reason for a website to show holiday decorations is to increase visitors’ joy of use. (NNGroup.com)
15. Great products do less but better.
Fabricio Teixeira, Design Director at Work & Co and Founder of UX Collective on Medium talks about the dangerous allure of adding more features to your product.
In their attempt to bring more happiness to the users, UX designers often turn the product into a Jack of all trades, doing so many different things that its value proposition starts to dilute.
Adding new features to the product is a common way of buying short-term, artificial happiness.
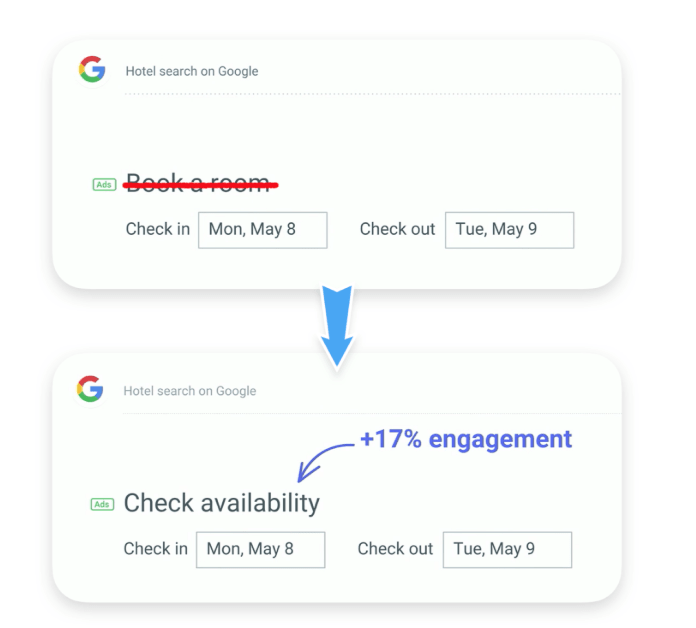
16. Get a UX writer on your team for great microcopy
UX writing is not a trend, but a new discipline. UX writers turn blocks of text into microcopy – a plain, concise and easy-to-understand copy.
A good microcopy helps users get to the next step in their buying journey. It shows care and understanding about their feelings at every step of the user flow.
UX writers create the right microcopy that can influence business profits.
When Google changed Book a room to Check availability, the user engagement increased by 17%.
Source: medium.com
17. 1 in 3 people will abandon a purchase because they can’t find the right information.
Make it easy for your buyers to get to the final click on your purchasing process.
Don’t add extra steps and don’t make it harder for them to find information.
18. ‘Enlarging a screen to click’ is the most frustrating mobile shopping problem.
Optimise your website for mobile display. Avoid frustrating your users with unnecessary actions.
On mobile, buyers expect brands to offer them a smooth experience.
19. 39% of people will stop engaging with a website if images won’t load or take too long.
No one has the time or patience to wait for your website images to load.
It shows a lack of interest in your users’ needs and a negative experience will prevent your users to visit your website ever again.
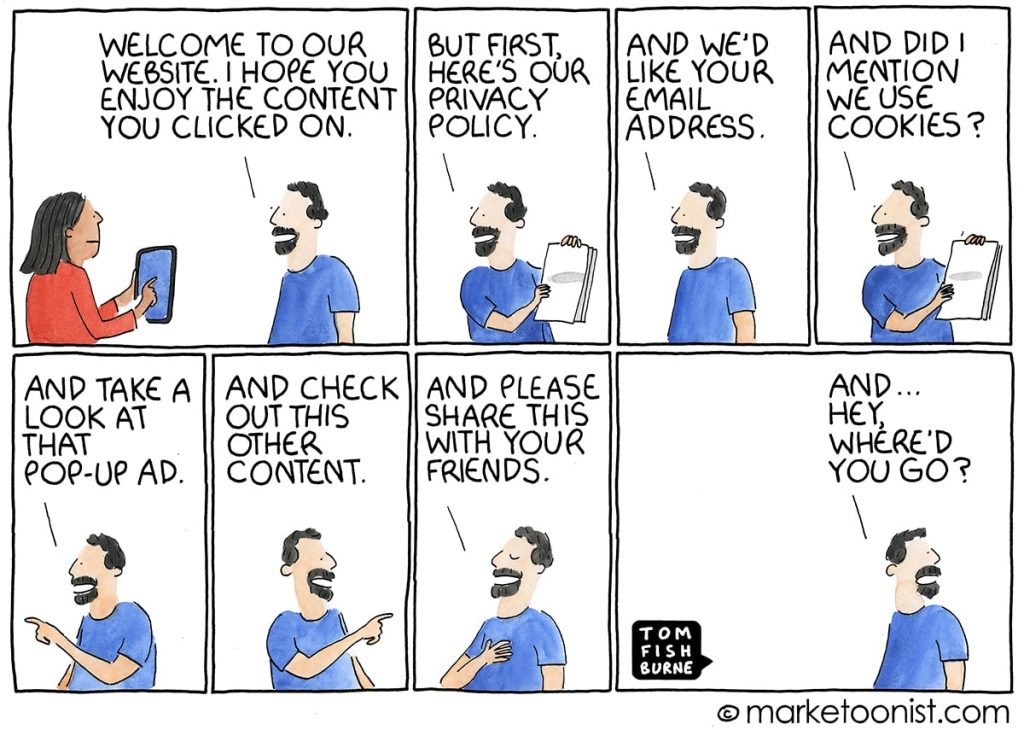
20. 65% of website visitors wouldn’t submit a form if too much personal information is required.
How much personal information do you actually need from your users? In this day and age, with major corporations selling our personal information to third-party platforms, sharing personal information is a very sensitive subject.
Ask your users for the most basic information while on-site and find other ways (like the mail) to complete their profile with personal details.
21. Visit-to-lead conversions can be 400% higher on sites with a “superior user experience”.
Source: marketoonist.com
22. 97% of business customers cite ‘ease of use’ as the most important quality for mobile apps.
What does ease of use mean when it comes to mobile apps?
It means helping your users achieve their goal in the most effective and efficient way possible.
Delete redundant steps and make your mobile app frictionless.
23. You only need to test with 5 users.
Contrary to the common belief, it takes only 5 users to test your website or mobile app.
As you add more and more users past five, you learn less and less because you will keep seeing the same things again and again.
After the fifth user, you are wasting your time by observing the same findings repeatedly but not learning much new.
24. The F-shape scanning pattern is bad for businesses. Good design can prevent F-shape scanning.
The Nielson Norman Group (NN/g), pioneers of the research-based user experience identified the F-shaped reading pattern for web content in 2006.
What exactly is the F-shape pattern?
It’s users reading the first lines of web content text and the first few words on the left of each line of text.
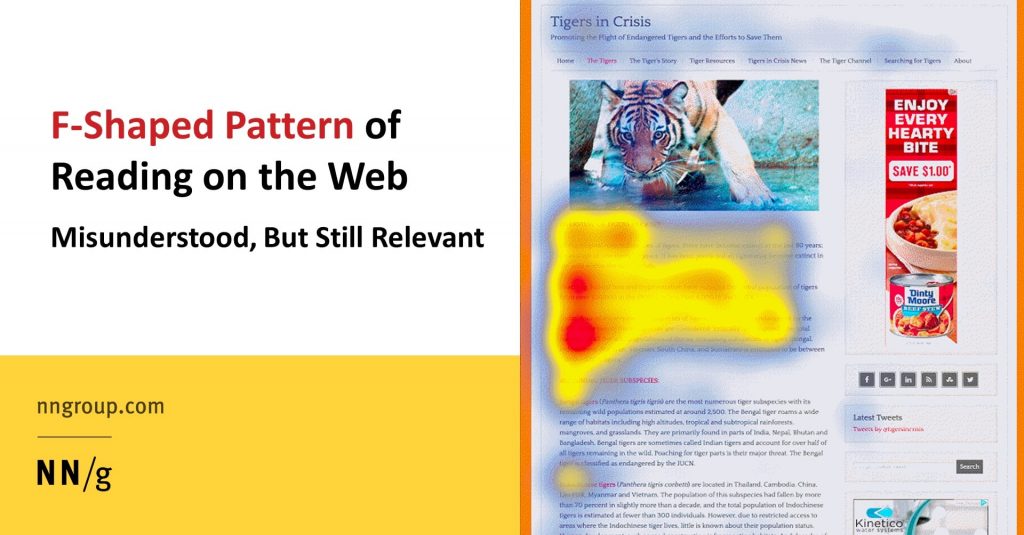
Source: nngroup.com
25. UX in motion keeps the user engaged: a new, easy and great way of presenting your product.
Are you looking to keep your users engaged?
Use UX in motion to present your product.
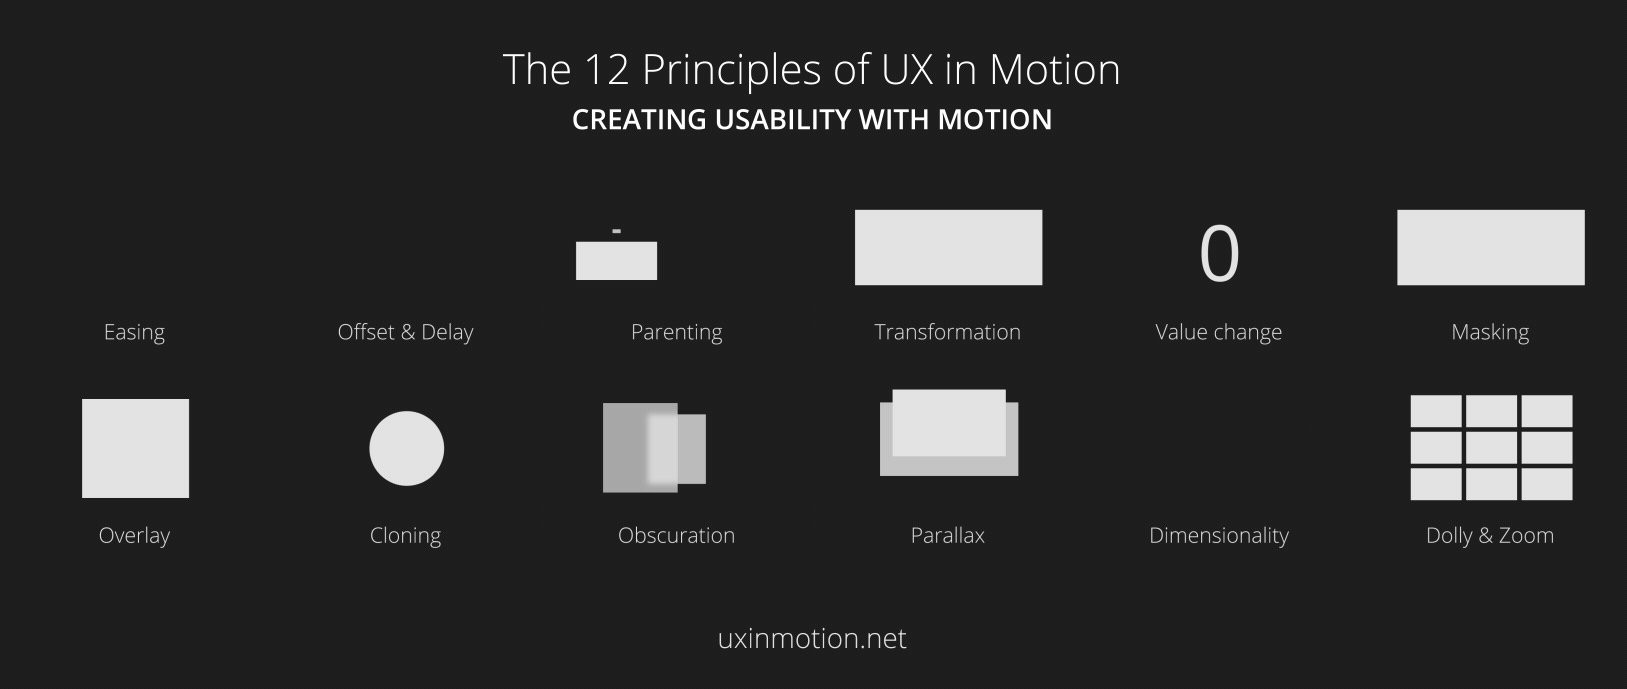
Source: uxinmotion.com
26. Make your UX design aesthetically pleasing.
Always remember that attractive design is more likely to be used and loved.
Join the Conversation
We’d love to hear what you have to say.
Get in touch with us on Facebook Group and Twitter.
How much time people spend connected to their smart devices?
How much time people spend connected to their smart devices?
The short answer is all the time!
But what all the time means exactly?
Let’s dig in a little deeper!
The 2018 Digital Future in Focus report from ComScore shows very interesting statistics related to our smart devices usage and consumption.
The report investigated 13 countries: USA, Canada, France, Germany, Italy, Spain, UK, Argentina, Brazil, Mexico, India, Indonesia and Malaysia.
Here are our main takeaways:
1.average time spent on connected smart devices: 4 hours
2. multi-platformers (mobile, desktop/laptop, tablet) remain a majority in most markets (46%), mobile only usage is 30% and desktop only – 24%; the countries that stand out is India (80% are multi-platformers) and France (60% desktop users)
3. multi-platformers consumption is still the norm, but mobile only is on the rise
4. mobile users consume more than twice minutes compared to desktop users (e.g.: Argentina 7000 minutes, Canada 2000 minutes)
5. entertainment and video flourish on mobile platforms
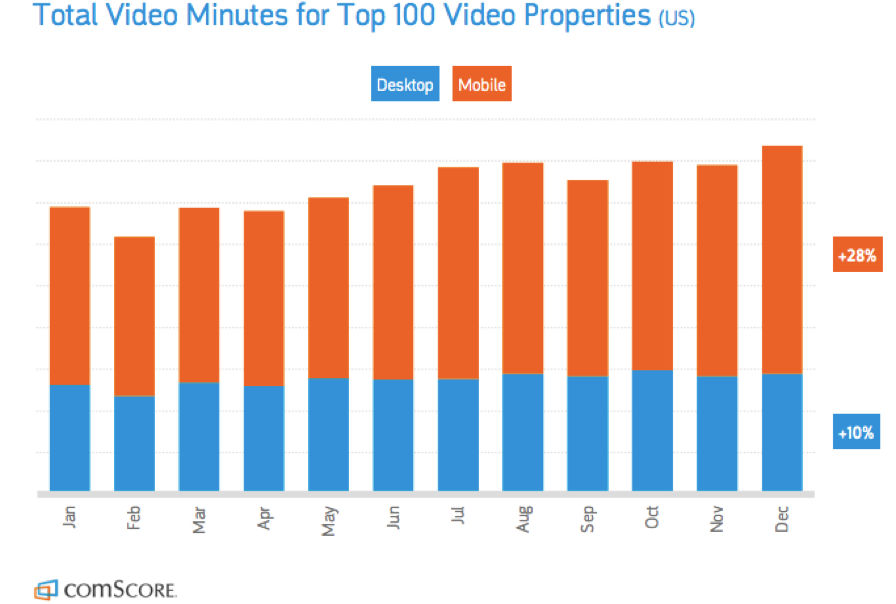
6. smartphone takes largest share of global digital minutes
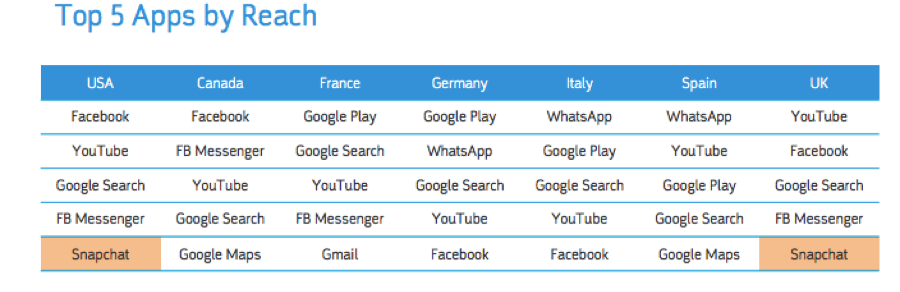
7. here is the top 5 apps by reach
8. mobile apps account for over 80% of mobile time
9. mobile-only audiences are now second only to multi-platform users
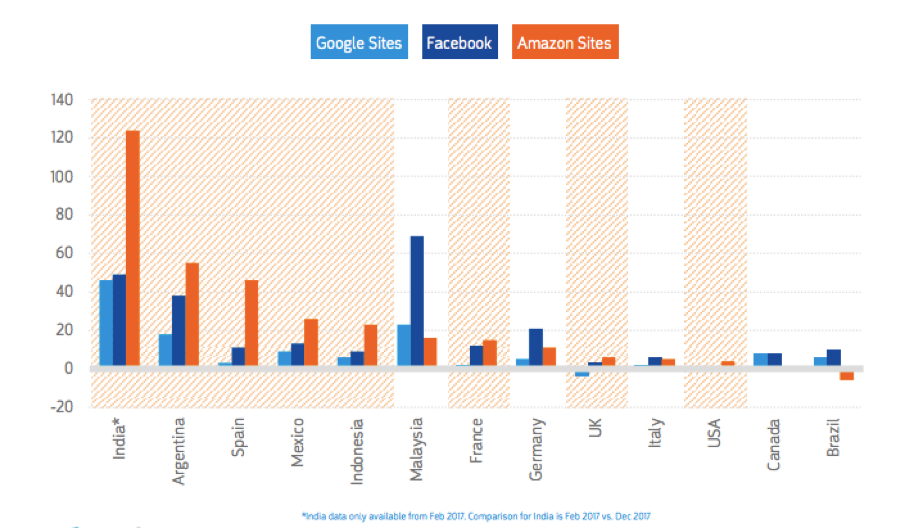
10. Amazon sites are slowly surpassing Facebook and Google sites
11. markets which have a mobile audience larger than its desktop audience: India, Indonesia, Mexico, Spain, Brazil, Italy and Malaysia
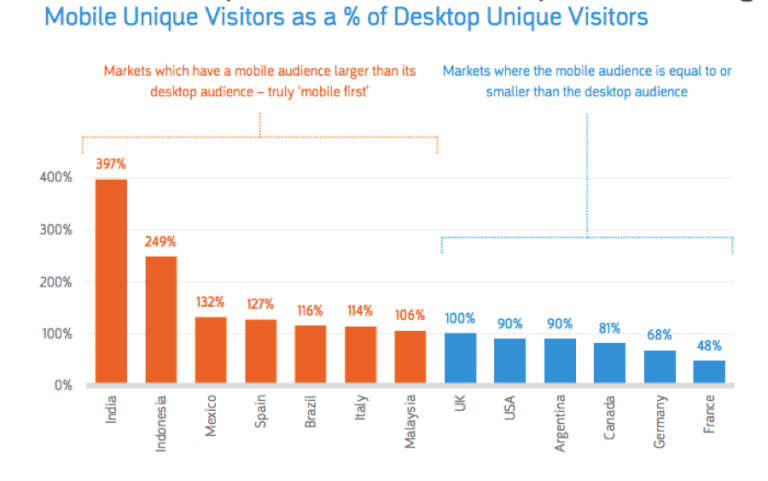
12. markets where the mobile audience is equal to or smaller than the desktop audience: UK, USA, Argentina, Canada, Germany and France
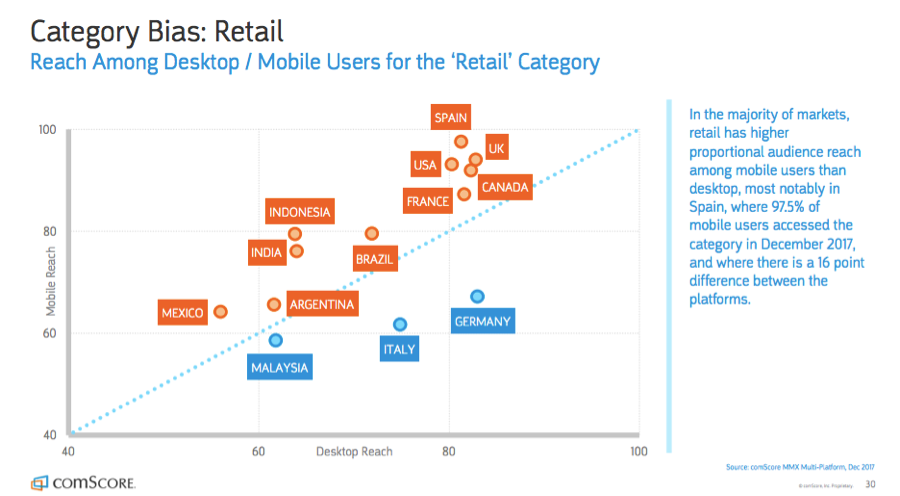
13. in the majority of markets, retail has higher proportional audience reach among mobile users than desktop, with Spain leading by 97,5%; at the other end of the spectrum, there are Germany, Italy and Malaysia where users access retail by desktop
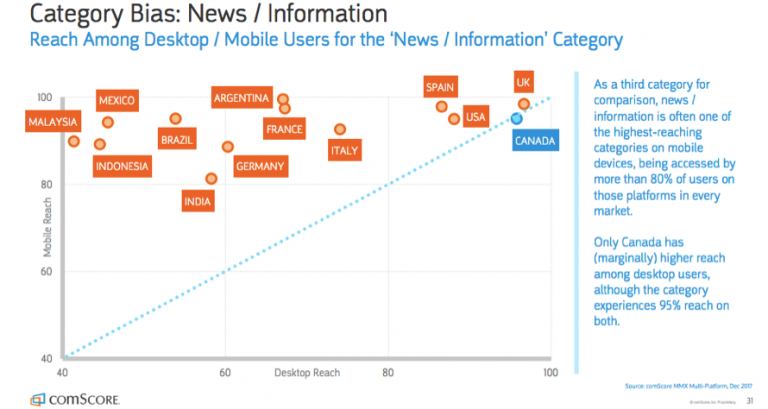
14. when it comes to news and information, 80% of users in all markets access this category by mobile, except Canada where 95% of users turn to desktop
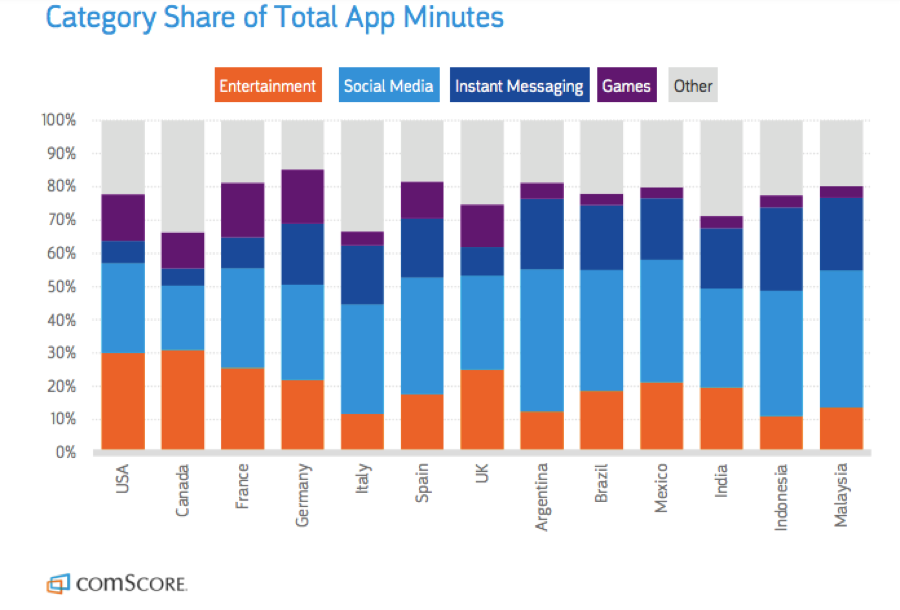
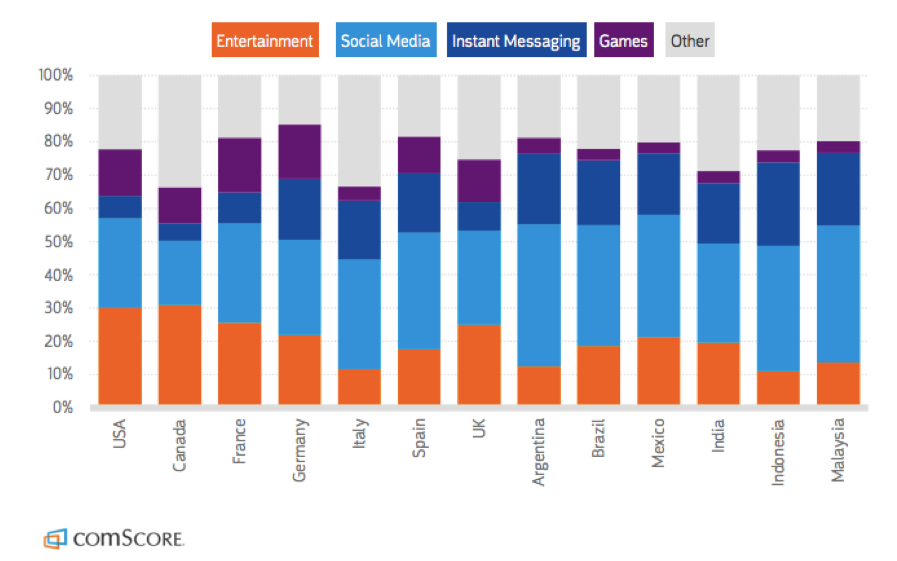
15. people use their app minutes for the following categories in this order: social media, entertainment, instant messaging and games
16. the most popular social network is Facebook by far, followed by Instagram, Snapchat and Twitter
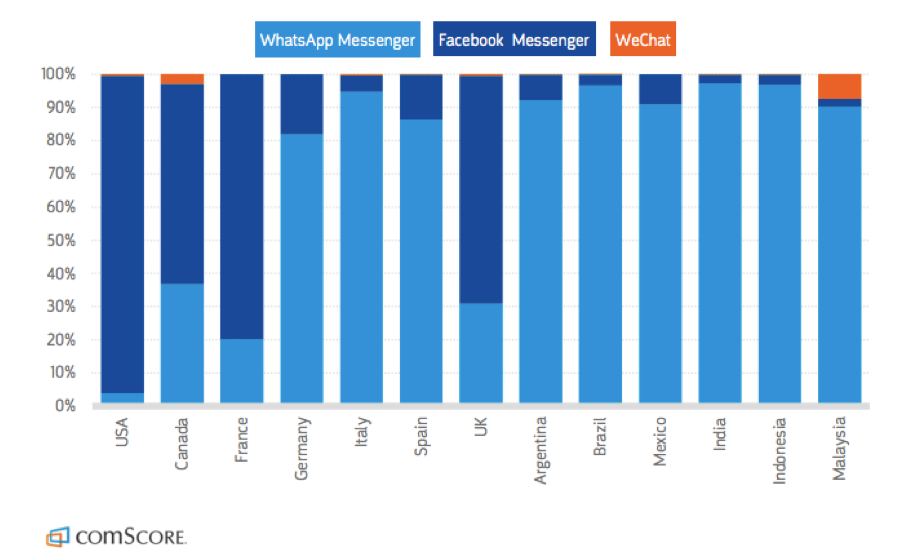
17. most popular instant messaging app is WhatsApp Messenger, followed by Facebook Messenger and WeChat
screenshots: comscore.com
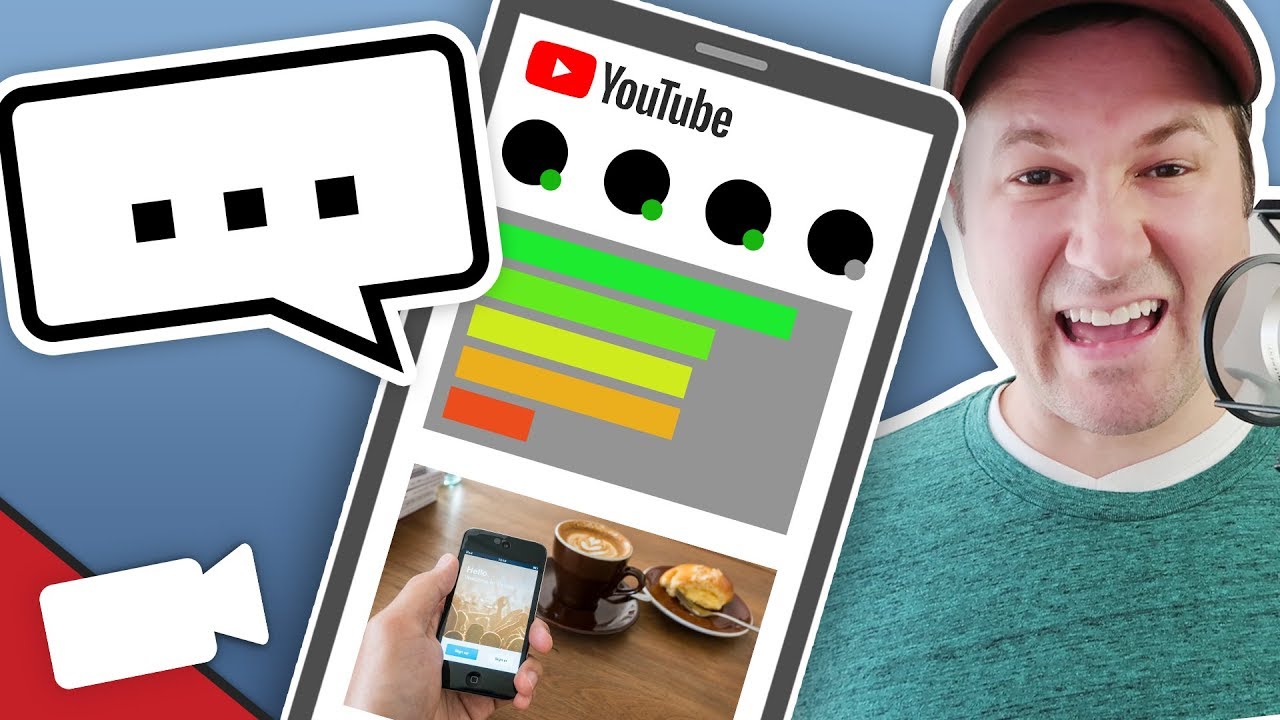
How To Engage With Your YouTube Subscribers To The Full Potential
Over the years, YouTube has become the go-to place for content creators to showcase their amazing work to a massive audience. YouTube gets over 30 million visits a day, according to blog.elink.io. And in a period of time when Facebook is pushing a lot on video content, YouTube decided it’s high time it got back on its target radar as the number one video platform out there. Therefore, one of its moves was creating YouTube Community, a place for YouTubers to interact with their fans and followers in a very friendly environment. The YouTube Community gives creators a space to post various types of status updates – polls, pictures, text, GIFs, links and more. Subscribers and other visitors can then like or comment on these posts.
At launch, YouTube had extended the feature to just a few creators, and, according to engadget.com, the rollout has been slow ever since. But the response has been pretty positive and YouTube said it planned to add more channels following the launch. And, in fact, at the end of November last year, YouTube today announced that its Community feature is available to anyone who has a channel with more than 10,000 subscribers. The YouTube Community tab replaces the Discussion tab, the place where creators and viewers used to have general conversations. The main difference between the Community tab and the Discussion tab is that the Discussion tab was purely text-based, whereas the Community tab allows a variety of posting and discussion capabilities.
To get inspiration for your own community posts, follow the community posts of channels you subscribe to by visiting their Community tab or by viewing the Subscriptions tab of the YouTube app.
“It’s extremely important to engage with your users in the comments section. Try to respond to every comment you get; not only will this help your video engagement, it’ll help you mold your community as you see fit. Also, the more engaged a specific user is with your channel, the higher the likelihood that your videos will make it into their emails and notifications,” wrote Jayson DeMers for Forbes.

How to use the community tab feature to its best capacities? Here are some steps that will help you along the way:
- Tell your followers about the new feature and how you intend to use it, for them. To add a link to your Community tab in the video description, open the tab and copy the URL from your browser’s address bar. Share the video on your Community tab to make sure first-time visitors to this tab know what they can do to engage with your channel.
- Reach more. Try cross promoting other channels and creators, or promote your own second channel through the Community tab. This is a handy way of increasing your reach and letting people know about the other content that you care about.
- Make sure your subscribers enable the notifications. You may use a video or a community post (or both) to let subscribers know how to get notified about your latest channel activity. Tell them that they need to click the bell icon to the right of the button they use to subscribe.
- Use polls to get to know more about your target. Polls are a great way in which you can easily find out if they liked your video or not or what they want to see next. You can then refine your content based on their suggestions and provide more quality content to your audience.
- Promote your products. “Post a status update to the tab with an image of your product and a link to the product’s sales page. Consider creating a special landing page on your website for your channel subscribers and offer an exclusive discount just for YouTube visitors to measure the results,” said socialmediaexaminer.com.
- Create teasers with the following content of your videos or/and of important launches and events you have for your brand. Offering this exclusive new content will spark their interest and get them on your channel when you launch the new finished product or service. At the same time,you can also promote successful past videos for the people that haven’t seen them yet.
- Share exclusive GIFs and memes. Don’t forget we all want to have fun and enjoy our lives and we were drown to the social media platforms because they offered just that. A brand that can show emotion and humor is a brand that will always win people’s hearts and one that they can relate to.
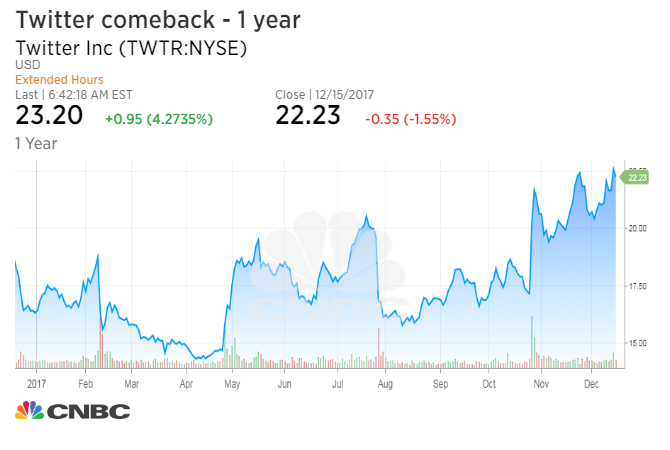
Will Twitter rise up in 2018?
As in the last years Facebook took the face off Twitter, specialists started to wonder if Twitter isn’t close to taking MySpace’s road and die. and many were starting to believe that will be the reality. But, in fact, the end of 2017 and 2018’s start show a revival of the social media platform.
“Twitter stock has been on fire, soaring some 16% in the past five days, including an 11% surge on Monday, thanks to a major endorsement from J.P. Morgan analyst Doug Anmuth, who named Twitter among the firm’s best stock ideas for 2018. Investors wasted no time buying into the idea that Twitter’s worst days are behind it,” wrote Richard Saintvilus for Nasdaq at the end of December 2017.
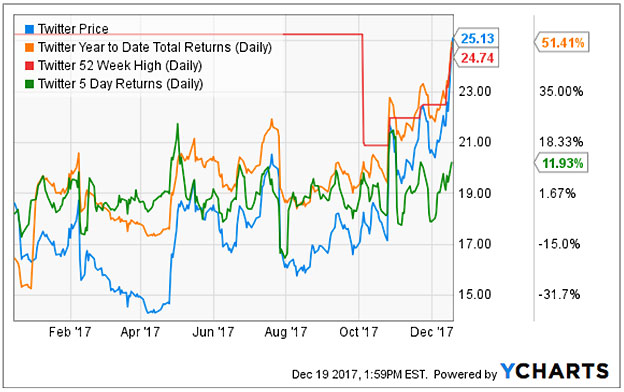
The company’s improved live-streaming capabilities is one of several factors Anmuth sees as increasing Twitter’s growth, including an expected 10% increase in daily active user growth in 2018 and an advertising revenue growth greater than 8 percent. Moreover, he expects the company to be profitable in 2018, which would mark a significant leap in the company’s investment profile.
“We believe both the TWTR story and financial results will strengthen over the next year as the company continues to build on its differentiated value proposition for users & returns to revenue growth,” wrote Doug Anmuth,quoted by CNBC.
Moreover, according to MarketWatch, Bloomberg is bringing a news network to Twitter, in partnership with heavyweights including Goldman Sachs, Infiniti and AT&T. That is a great marriage between content and advertisers, proving the platform has a bigger monetization strategy than just random sponsored tweets. Twitter also launched pre-roll ads that can play before livestreams on its Periscope video platform. More recently, the company has started offering a more accessible way for developers to tap into content and data on its platform. There have also been rumors of a paid-subscription service on Tweetdeck for its most loyal and devoted users.
Is it illegal or not to regram?
Copyright is always an issue than one posting on social media should be careful of and pay attention at. Due to the fact that Instagram doesn’t include the ability to regram directly within the app, many people have feared that this practice of sharing other people’s content is actually a violation of the Instagram terms of service (TOS).
Moreover, there was a statement published some time ago that was saying that in the Instagram’s terms of service sharing content other than your own was a violation of the platform’s terms. Therefore, regramming was a violation.
But, according to socialmediaexaminer.com, Instagram has updated their TOS to state that you’re responsible for any content you post on Instagram. Sections 7 and 8 speak directly to the types of content you’re responsible for. And one can read the most current version of Instagram’s terms here.
So what are the steps that somebody must take in order to make sure they are not breaking any laws or rules?
- Get permission from the owner to share his / her content. You can do that either by commenting on their post letting them know that you want to share their photo or video with your audience. Then you can ask if you can have their permission to repost it. You can also send the user a Direct Message asking the same thing. Once they give you response in writing, giving you permission to repost the picture, then you’d be allowed to repost the picture. If they don’t respond, don’t use it. Asking is not enough. You need actual consent.
Still according to socialmediaexaminer.com, there are two types of consent: implied and explicit. Implied consent is when users post content with the expectation that it may be regrammed (when the company or the brand has a running campaign with a certain hashtag that wishes it will bring along the wished target and, at the same time, is looking to engage them and make them share the info and get other people involved as well). Explicit consent is when the original content creator gives you direct permission to repost their content on your Instagram account.
2. Get attribution to the original user. Don’t forget to credit the person or the brand you are getting your information from.
3. Use the Repost for the Instagram app. Available for both iphone and android devices, repost for Instagram makes it easy to #Repost your favorite photos and videos on Instagram while giving credit to the original Instagramer. The benefit of using this app is that it will add a watermark to the image with the original post creator’s Instagram username. This makes it clear that the content is regrammed and provides attribution to the original creator.
4. There are now also a variety of platforms and services designed for brands to ask users if they can use their content. According to Debbie Miller, on her article on agorapulse.com, one example is a Content Rights Solution designed by TINT who creates a variety of social display tools. “The solution allows you to discover content relating to your brand, request the proper permissions from the author of the image via social media, and track which images to which you have rights,” explained Miller.
More on how to protect yourself legally you can read here.
5 domains that will be revolutionised by VR – part I
The virtual reality is here and ready to help not only entertain, but educate and influence profoundly our lives, for the better. Here are 5 domains that already see a big influence and that will see even more in the future.
- The real estate industry
Virtual reality can be a great asset when it comes to the real estate. From buying a house, 360 views and being a help for the real estate officers, VR can come in handy and prove to be really helpful. When it comes to open houses, a majority of the real estate domain is moving, well, to domains. The entire estate agent process can be performed online on sites like eMoov and CastleSmart, with virtual reality added in, buying a house is about to become a whole lot more lazy.
When a client is interested in buying a specific property the estate agent will usually arrange a viewing of said property or, in more lavish cases, host an open house. These events allow the potential buyers to walk through the home and examine the property. Now, imagine the prospective shopper was able to view the property from the comfort of their own home. Likely it would result in a greater interest for that residence which would create a faster sale. With VR this is very possible. Clients could put on their headsets and could be electronically strolling through the property within seconds. This means a lot of time and resources that are speared.
Moreover, the virtual reality can help so that the entire inspection could take place from the workplace of the agent. Several images and videos of the property would need to be taken to ready the virtual home for inspect. The same procedure would need to take place if a valuation was to be made via VR.
Also, most trainee estate agents learn the ropes by shadowing one of their senior colleagues on the job, following them around on viewings, visits and valuations, etc. Virtual training methods could be created which pits the user in situations that they would face on the job, such as getting questions from potential buyers, explaining features in a property. This could save real estate firms thousands in training expenses.
2. Education
According to the Smithsonian Mag, the students in classrooms across the United States and parts of Europe will soon be able to go on field trips to Buckingham Palace, Machu Picchu and the Great Barrier Reef, but they’ll be doing it through virtual reality. Google recently announced that it is expanding its Expeditions Pioneer Program, which brings virtual reality field trips to classrooms using Google’s cheap, smart phone-based VR viewer, Cardboard. The goal is to expose students to places they wouldn’t be able to see otherwise.
The idea for Expeditions came from a hackathon in Google’s education department. Given 36 hours to create a tool that would boost student engagement, Jen Holland, then a product manager at Google Apps for Education, drew on existing Google assets—the recently launched Cardboard, some teaching apps in development and a huge archive of 3D maps and photographs. She combined the three to make interactive virtual reality lessons, which she calls “experiences.”
Students can use Cardboard—an inexpensive pair of VR goggles made from a cardboard cutout, magnets, an Android phone and an app—to move through an experience that their teacher controls from a tablet. The Expeditions program has distributed the equipment to classrooms and worked with teachers to figure out lesson plans, but now, Holland says, they’re opening it up, so any teacher with a tablet and access to VR viewers (Cardboard costs about $20) can use it. With lessons loaded on the tablets, teachers and students don’t need to have internet access, which is important for low-resource classrooms.
Once students put on the VR headsets, they’re immersed in a 3D version of Machu Picchu or the Smithsonian’s National Museum of Natural History. They can look around, and the teacher can share information about things they’re seeing. Google built a Great Wall of China experience for a fifth grade math class, to give the students a more tactile lesson about multiplication. The same experience has been the topic of conversation in a 10th grade Chinese language class, and it provided physical context for students in a 12th grade history class and an anthropology lecture at a Brazilian university.
More you can read here.
What is “over datafication” in marketing?
Datafication refers to the collective tools, technologies, and processes used to transform an organization into a data-driven enterprise. After converting processes to data, they can be tracked, monitored, and optimized. Even if data isn’t used, businesses can still acquire large amounts of data, store it, and then decide later on how they will utilize it.
According to Key LimeInteractive, new technologies have enabled lots of new ways to “datify” our normal activities:
-
- GPS devices on smartphones, such as Google maps, are able to track where we are at certain times of the day
- Going for a jog/walk – one can monitor distance, speed, pulse, heart rate, number of steps
- Sleep schedule – quality of sleep, duration, number of sleep interruptions during the night
- Shopping – how much food to purchase, finding lowest prices, monitoring quantities consumed in a household
- New smart technologies are making it easier to truly get to know our customers and allow us to make better marketing decisions.
We also believe that we need to pay attention to the fact that is a great difference between datafication and digitalization. The Impact of Datafication on Strategic Landscapes – a report published in April, 2014 by Ericsson in collaboration with the Imperial College Business School and the UK’s Sustainable Society Network explains the differences and interrelationship between datafication and digitalization. As Irving Wladawsky-Berger points out on his blog here , there are four important areas where data science is already having an impact: datafying personal behaviors, datafying business processes, datafying cities and datafying private lives.
But what happens when it comes to over datafication? According to the info offered by MarchTech forum, more and more companies are entering the Big Data into their global and corporate strategy, the big data companies registering an annual growth of up to 12 % by 2020,while in 2016 the volume of the market being over 150 million dollars.
With this growth come also the problems, as the Spanish Zenith Media’s blog points out. The over datafication brings with itself a data dependency of many analysis business sectors. Still according to Zenith, an excessive subordination to Big Data can cause the slowing down of the company’s natural processes, determining the marketing representatives to only look at the data and being unable to date a decision if they are not supported by it. This could only lead to a tendency of sacrificing the creativity and the originality.
Moreover, the data dependency would generate a lower risk-taking rate trend, that, on a long term, could put in peril some of the most important marketing functions and its interactivity with the users.
In other words, the over datafication would represent exactly what creative people were afraid of when it came to research companies and using research in their day-to-day creative processes: less innovative campaigns, but easily measured; data used wrong; the change of the strategy over-night in case of lack of results or poor ones,etc.
But in the end, it all comes down to measure and attention. Finding the balance is the key to success. “The speed of change means that marketers need to have confidence in the strategy not to panic if the data shows they have had a bad week, as the next week could be great,” writes Marketing Week.
Gmail versus Outlook: which e-mail provider is better for you? Part I
According to a Radicati Group study from January 2017, there will be more than 3.7 billion email users worldwide by the end of the year. That means that nearly 54% of the entire planet is currently using email. Putting things in perspective, the same group reported about 1.9 billion worldwide users in May of 2009 and projects that that number will reach 4.1 billion by 2021.
According to wikipedia, Gmail dates from 2004, but Official Gmail Blog tracks the public history of Gmail from July 2007. In February 2016, Gmail reporter 1 billion monthly active users, up from 900 million the company announced during its I/O developer conference in May 2015 and up from 425 million in 2012, says TechCrunch. Outlook was re-launched by Microsoft in 2012 Microsoft migrated all Hotmail users to Outlook.com. The fledgling service has a ton of unique features including Clutter, email rules, and integration with Outlook calendar. In early 2017, Outlook.com had a reported 400 million users. However, that number hasn’t changed as drastically as Gmail’s statistics. In July 2011, Microsoft was said to reach 360 million active users for its Windows Live Hotmail service worldwide.
The Radicati Group counts the 3.7 billion email users in January 2017 as both consumer and corporate users. However, because it isn’t clear how the email accounts are differentiated between consumer and business users, it’s hard to measure the accuracy of the statistic.
Therefore, we decided to take a look at the most important two email providers: Gmail and Outlook, and give you the possibility to have a clearer picture on which one you would prefer better. Both Gmail and Outlook offer both free and premium versions. The premium email versions have, naturally, more features.
| Google’s Gmail | Microsoft Outlook.com | |
| Storage | 15 GB. The storage limit is shared between Google Drive, Gmail, and Google Photos. If you’ve reached your limit you can buy extra storage. Your Google Account also has storage in the cloud-based Google Drive. | While the actual limit is unclear, it appears that you start with 5 GB of storage and this amount increases over time. Your Microsoft Account also has storage in the cloud-based OneDrive. |
| Search Capabilities
|
Search any combination of the following elements using the advanced search:
|
Outlook.com has a simpler search. The search mail or people option allows you to search any combination of:
Or you can search your contact list. There is a separate search for Skype as well.
|
| Security | Includes 2-Step Verification and spam detection. You can enable a verification icon for emails from verified senders through Google Labs. | Includes 2-Step Verification. Uses trusted sender icons for emails from trusted senders. Suspected spam messages appear with colored red or yellow safety bars at the top of the message. |
| Inbox Organization
|
Default Gmail organization is based on labels and up to five tabs. Assign colors to labels and use stars and other symbols to flag important messages. Also, you can convert your inbox to a classic inbox or a priority inbox. | Default Outlook organization is based on categories, folders and subfolders. Flag important messages or pin them to the top of the folder. |
| Instant Messaging | Gmail uses the Chat function for instant messaging. You can find the Chat icon towards the bottom of the Gmail inbox on the left. | Outlook uses Skype for instant messaging. You can find the Skype icon in the upper right corner of your inbox. |
| Contact Management | Import contacts from a variety of other email providers including:
Import a CSV or vCard file. Import contacts from your Google+ social media account. |
Import contacts from other sources, including:
|
| Advertisements | Ads appear as emails at the top of your inbox tab. The word “Ad” appears in a yellow box to the left of the subject line. | Outlook.com uses display ads that appear to the right of your inbox. They take up quite a bit of space on the screen. |
| Extras | Incorporates tasks, customizable themes, Google Lab. | Incorporates calendar, tasks, customizable themes. |
source: Business Tuts Plus
Head to head
Calendar
As process.st points put, neither platform has a real solution that lets you view your calendar and email side-by-side. While both Gmail and Outlook sync events with your calendar, neither let you view your calendar and inbox at the same time, in one tab. When you click on the Outlook tool bar, you’re taken to a separate calendar window. On the other hand, when you click on Calendar in Gmail, it keeps your inbox open, and adds a new window (or tab) with your calendar.
Neither Gmail nor Outlook lend well to multi-window viewing. At least Gmail lets you view your calendar and email at the same time.
User Experience (UX)
Text in Gmail is larger than in Outlook. Coupled with the clear definition between bold and non-bold text, as well as the inbox shading available with most templates, Gmail is generally softer on your eyes. So if you are spending a lot of time in front of the computer, you might prefer Gmail on this one. Moreover, the provider is very useful when it comes to unread emails. “Read” emails appear in a darker shade than “unread” ones. “Unread” emails are also distinguished, because their sender and subject are in bold.
Outlook differentiates these by putting the sender and subject in blue. It’s bold too, but since the text overall in Outlook is flatter and smaller, you still need to squint to see if something is a new email. More opinions you can find here.
Filters & Organisation
Besides the already known features, lifehacker.com, points out that Gmail uses labels and stars instead of folders (although it has faux-folders, too.) You can apply multiple labels to your messages, which gives you greater flexibility in setting up exactly the kind of organization scheme you like, and stars let you set aside the most important emails for later. You can even enable Smart Labels that Google can apply labels like Finance and Travel automatically.
Gmail also uses a priority inbox system to automatically find messages it believes are important to you. Emails are deemed “important” based on who you email, which messages you open, what you interact with and other criteria. You can also manually mark an email as important to help it learn.

End of part I.
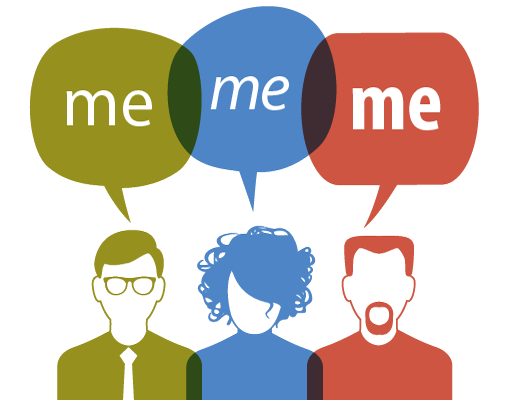
Personalization online shouldn’t be too personal
We don’t like to be looked at in groups anymore. We hate the idea of being seen as one and the same as others around us. We want to brands to find a way to address us and our desires and issues with a personalized message, with an as clear as possible idea of whom we really are, each one of us. It’s a reality that more and more quantitative and qualitative researches show. For example, according to eMarketer, 80% of users find emails with personally recommended products helpful – but can be turned off by display ads that follow them around the internet as they read the news or check Facebook.
“Users like it when they feel like you’re helping them, not when you know where they live or publicise your purchases.Essentially, it’s important to find that sweet spot where personalisation doesn’t feel too personal. This personalisation works because it adds value to their experience. It helps them find what they want. It’s streamlined and doesn’t follow them around as the browse elsewhere. It’s personal, but the user itself controls the action. If that email converts, it’s because the user themselves opened it and decided they wanted to buy. It’s a reminder as opposed to a salesman following them around a store, asking “do you want this now? How about now?”,” said Gurmeet Lamba, chief operating officer at Sentient Technologies, for Campaign UK.
According to Econsultancy’s Quarterly Digital Intelligence Briefing: 2016 Digital Trends, the priorities that sit atop marketers’ lists are tied together by their focus on the individual: personalization (31%), content optimization (29%) and social media engagement (25%) are overlapping capabilities with the customer at the center. Moreover, nearly half (46%) of respondents rank the process of creating a cross-team approach with the customer at the heart of all initiatives as 4 or 5 on the difficulty scale.
In terms of marketing, personalization is when content is tailor-made with an audience segment or individual user’s characteristics or preferences in mind. This is typically based on previously collected or readily available data, such as website browsing behavior and interests on social media.
By doing so, marketers have a better chance of meeting consumer needs more effectively and efficiently, as content will be written about particular subjects or with a certain tone of voice, published on appropriate platforms, and promoted through relevant channels. This also results in easier, faster and better interactions with online audiences, which can contribute to user satisfaction, strong relationships, and brand loyalty.
A study conducted by Yahoo finds that most consumers are not only aware of online personalization, with 78% of those surveyed expressing a desire for some type of personalized content. And, according to Piers North, strategy director at Yahoo UK, quoted by The Guardian, the greatest opportunity for marketers today lies in managing personalization on mobile devices. He admits, however, that this is not easy and he points out that access to data is the key.
Therefore, personalization should be done with a lot of attention in order to be relevant and bring true value to the table. Despite all the opportunities that might occur in the online business today, for increased personalization, it’s important not to personalize for personalization’s sake – nor to become fixated on the latest tools or techniques.
In fact, Michael Smith, marketing leader for mobile and social business at IBM, quoted by Lucy Fisher for Marketing Week, warns it is easy to chase after personalization strategies “just because you can”. He says: “Customers want engagement with some brands, but not others. Whatever we do, it has to be with the customer in mind”.
We leave you here , with a psychological explication about why people love and crave for customized experiences.
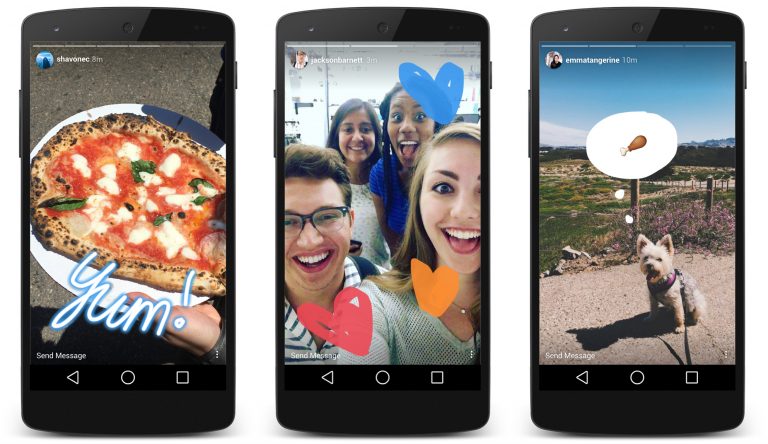
5 Free Instagram Analytics Tools for Marketers
Finding the right strategy that will for sure help your brand is not an easy task. The right Instagram tools can provide analytics to inform your social media strategy and content scheduling. If you are looking for some free tools to help your business on Instagram, we have 5 ideas that would come in handy.
Instagram Insights
If you’ve set up your Instagram business account, you have access to free analytics through the Instagram app. Instagram Insights provides basic stats for assessing your Instagram marketing efforts. Find out more about your followers, when they’re on Instagram, and what your top posts are. This information will help you choose content more likely to resonate with your audience.
To access these insights, tap the bar chart icon in the top-right corner of the app. The first analytics screen shows high-level insights for the last week and comparison stats for the week before. You can view your total impressions, reach, profile views, and website clicks. It also shows your top posts and stats for your Instagram stories from the last 24 hours. Swipe to the right to see your reach. Swipe right one more time to see website clicks data.
source: TechCrunch
You can also view your top posts insights, just by tapping the see more link next to top posts and the top six posts from the past seven days sorted by impressions. The tool also allows you to see followers insights. Back on the main Insights page for your account, scroll down to the Followers chart of times when your followers are on Instagram. Also, if you’re running paid Instagram ads, the Promotions section of the main Insights screen gives you relevant stats on your campaigns.
Socialbakers
With Socialbakers, you can get a free report on your most popular Instagram photos, filters, and hashtags, and all of your interactions with followers. The most useful sections are the most liked and most commented posts because this information can help inform the types of images you use in future Instagram posts.
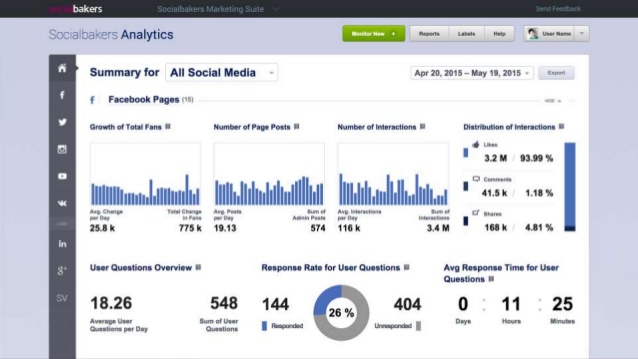
To get your free report, go to Socialbakers’ Free Instagram Analytics Tool and click Login With Instagram.
Simply Measured
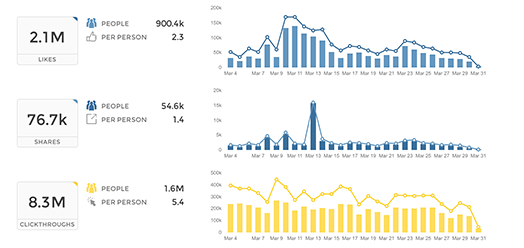
Simply Measured offers a free Instagram report for users with up to 25,000 followers. The stats and insights are presented clearly and will help inform your Instagram posting strategy. The report lets you quickly see what has worked well in your Instagram marketing, so you can apply these insights to future posts. To get started, type your Instagram account name in the text box and click Authenticate With Any Instagram Account. Then log in and authorize Simply Measured to access information from your Instagram account. When you receive your report, you’ll find three tabs of information: Charts, Scorecard, and Appendix. The buttons in the top-right corner of the screen let you download the report to Excel or export it to PowerPoint.
On the Charts tab, you can view a wealth of insights about your most engaging posts and average engagement per post. Moreover, the Engagement chart shows Instagram engagement over time. See total engagement, engagement as a percentage of followers, and information on likes and comments your photos and videos received.
You can also examine the Scorecard (it gives you some basic stats about your Instagram account) and Appendix Tabs (check out a table of your top posts sorted by highest engagement with the date of the post, type, likes, comments, and total engagement – likes and comments).
It offers a free Instagram account checkup to assess how you’re doing on the network. While the report isn’t as comprehensive as some others, it offers handy nuggets of data for marketers. It helps you determine the best time to post, which hashtags to use, and what content to post more (or less) of. It also highlights your top followers and reminds you to engage with them. To access your free report, click Start Your Checkup on the home page and then sign up for a Union Metrics account.
You can view the number of posts by day. Use the icons in the top-right corner of the page to share, print, or download your report. Scroll down to examine more stats with recommendations from Union Metrics, such as the best time and day to post. You can also view stats and visuals for your top-performing posts. If you click the circles on the hashtag report, you can see more information about the hashtags, which is a handy feature.
Squarelovin
With Squarelovin, you can get free basic Instagram analytics. The Optimization section offers insights that help inform Instagram posting. The “worst times to post” information is especially valuable. First, you’ll need to sign up for a Squarelovin account. On your dashboard, you can view high-level stats and access additional analytics screens. On the Postings tab, you’ll get information on your post history and top posts. It also shows your posts by year and month and day and time. The Engagement tab shows information on likes and comments, and highlights the top liked and top commented posts. The Optimization tab shows the best time and day to post on Instagram, but also the worst times to post on specific days.
If you use different filters on Instagram, you can also view the impact of those filters. Moreover, the report lets you see all of the Instagram hashtags you’ve used next to a list of the most popular hashtags. You can quickly see if you’re using top hashtags or if you need to rethink your hashtag strategy.
Understanding whom your Instagram fans are and what content they engage with and when will give you ideas for future content to share on the network.