


10 Less Known Facebook Features That Help Marketers
The most loved and used social media platform is changing so fast that is hard to keep track of all of its novelties. Social media specialists are spending more and more time online reading and trying all about the new changes in order to bring them and explain them to their clients and followers.
This is the main reason we decided to focus today on Facebook and show you some of the most important features you, as a marketer, shouldn’t forget to focus on when it comes to your business Facebook page. Especially because they tend to be forgotten, while they have an important role of their own. In no particular order, here they are:
- The download your Facebook history for business analytics option. You will have your entire Facebook history at your disposal, finding: review all the posts, photos, and videos you’ve shared; your messages and chat conversations; past info from the About section of your profile; ads you’ve clicked on; historical data, facial recognition data,etc.
-
- Travel agencies and tourism boards could let people explore certain places in VR before buying their tickets.
- Real estate companies could let potential buyers look at houses in VR before actually visiting the houses.
- Furniture companies could let customers “try out” furniture in their homes before purchasing.
- Clothes retailers could let customers “try out” clothes and chat with friends about them before buying, or even let them customize their avatars with their clothes.
- Education institutions and online learning platforms could let students attend classes together.
Facebook Spaces is a virtual reality (VR) app developed by Facebook that lets you invite and interact with up to 3 of your Facebook friends using a VR device. Right now, you can download Facebook Spaces for Oculus Rift or HTC Vive . Once you open Facebook Spaces in VR, you’ll be asked to take off your headset and log into your Facebook account.
For brands’ representatives this feature can be easily used, as Buffer Social says:

3. Free Images for Ads
When you create a Facebook ad, you can choose from a searchable database of thousands of free stock images from within the Facebook image library.
4. Prioritize Who to See First
Changing your news feed preferences gives you control over what appears in your news feed. To choose which posts you want to see first in your news feed, click the arrow in the upper-right corner of the page and choose News Feed Preferences from the drop-down menu. Then click Prioritize Who to See First. This feature allows you to select from both personal profiles and business pages that you’re following so their updates get visibility in your news feed. You can also choose to unfollow people so you stop seeing their updates without unfriending them. If you find that your news feed is too full of updates from groups, you can also mute them by unfollowing updates from them.
5. The Camera Effects Platform
This feature allows you to use trackers, data, animation and more to create interactive, shareable effects that respond to people and objects in their surroundings. Through the platform developers can create frames, masks, and special effects for the Facebook camera. The two main products on this platform are Frame Studio and AR Studio.
It’s the place where people can browse and find Messenger bots, nearby places and businesses to message. Organized by category, recent activity and featured experiences, Discover complements existing entry points, including advertising to Messenger Codes, me.me links and plugins. The Discover tab can be located in the lower right-hand corner of the Messenger home screen and will enable users to browse recently visited businesses, featured experiences as well as bots and Pages. The bots are categorized and listed under various categories for easier access.
Facebook has also added chat extensions to the Messenger app that allow multiple people to chat with the same business at the same time. This allows users to directly add a bot to a group thread and share the conversation with other users in the group. Moreover, The Discover tab works with new parametric Messenger Codes, where people can scan such codes through the Messenger camera and link to a specific brand or business.
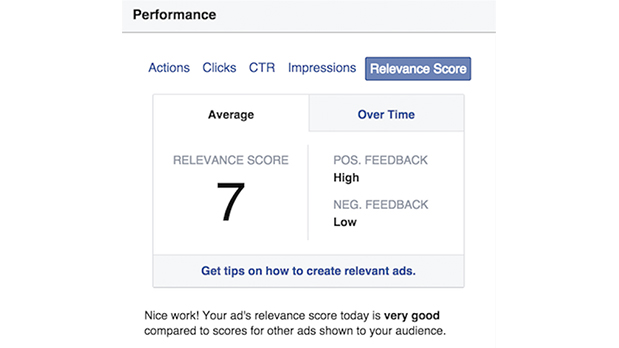
7. Relevance Score
Relevance Score metric is a measure of your Facebook ad’s effectiveness and the equivalent of Google’s AdWords Quality Score, in their ad reporting dashboard. This new score is an important ad quality signal that will affect both your ad delivery and the cost you pay for your Facebook campaigns. Facebook will use feedback from ad viewers to determine this score on a scale of 1 to 10, with 10 being the highest possible score.
According to Facebook’s statements, the new feature can lower the cost of reaching people (the higher an ad’s relevance score is, the less it will cost to be delivered). Moreover, bid matters too. “For instance, if two ads are aimed at the same audience, there’s no guarantee that the ad with an excellent relevance score and low bid will beat the ad with a good relevance score and high bid. But, overall, having strong relevance scores will help advertisers see more efficient delivery through our system. It can help advertisers test ad creative options before running a campaign. Advertisers can test different combinations of image and copy with different audiences, and learn which combinations offer the highest relevance scores”.
At the same time, the feature promises to help optimize campaigns already in progress. While ad campaigns are running, advertisers can monitor their relevance scores.
8. Smart Replies for Pages
Facebook intends to help small businesses automate some of the customer support processes. Using AI, Smart Replies helps Page owners to respond to the most frequently asked questions that they receive, such as business hours, directions, and contact details. “The AI would grab information from the Pages, detect the questions asked, and reply with the appropriate information. It can help free up some of your time for you to create high-quality content and engage with your audience on social media. As the AI would grab information from your Page, it’ll be great to keep your Page information updated,” wrote Social Buffer.
9. Competition monitor
On Facebook Insights the Posts’ area, you will find “Top Posts from Pages You Watch”. There you can track other pages, from partners, competitors to friends. You can take a look at the metrics and spot the likes, posts and engagement on these pages. Moreover, Facebook will suggest you some pages to follow. You can also type in the names of brands you want to check out and add them to the list.
10. The Auto-optimization Rules
You can set up four different consequences if the conditions have been met: turn off the ad campaign, ad set or ad; send notifications to the ad manager; adjust budgets and manual bids. In order to set up an automated rule set, select a campaign, ad set or Facebook ad and go to the editing panel (Icon on the right side of the reporting table). Next, click on the “Create Rule” button to create a new rule set. You can create rules by selecting some conditions and telling Facebook what to do once the conditions are met.
5 Free Instagram Analytics Tools for Marketers
Finding the right strategy that will for sure help your brand is not an easy task. The right Instagram tools can provide analytics to inform your social media strategy and content scheduling. If you are looking for some free tools to help your business on Instagram, we have 5 ideas that would come in handy.
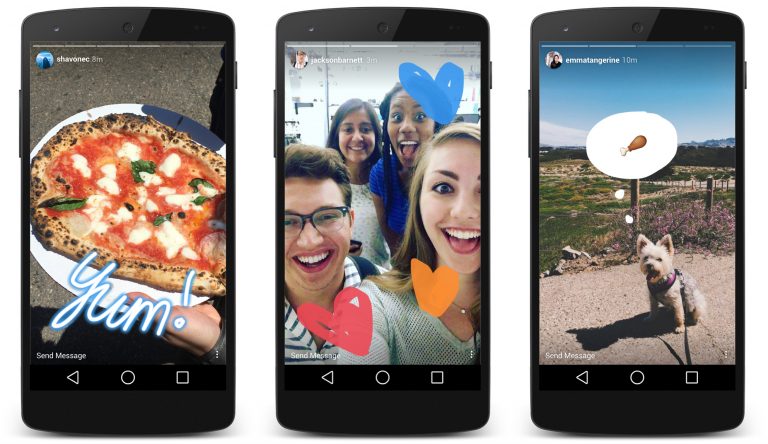
Instagram Insights
If you’ve set up your Instagram business account, you have access to free analytics through the Instagram app. Instagram Insights provides basic stats for assessing your Instagram marketing efforts. Find out more about your followers, when they’re on Instagram, and what your top posts are. This information will help you choose content more likely to resonate with your audience.
To access these insights, tap the bar chart icon in the top-right corner of the app. The first analytics screen shows high-level insights for the last week and comparison stats for the week before. You can view your total impressions, reach, profile views, and website clicks. It also shows your top posts and stats for your Instagram stories from the last 24 hours. Swipe to the right to see your reach. Swipe right one more time to see website clicks data.
source: TechCrunch
You can also view your top posts insights, just by tapping the see more link next to top posts and the top six posts from the past seven days sorted by impressions. The tool also allows you to see followers insights. Back on the main Insights page for your account, scroll down to the Followers chart of times when your followers are on Instagram. Also, if you’re running paid Instagram ads, the Promotions section of the main Insights screen gives you relevant stats on your campaigns.
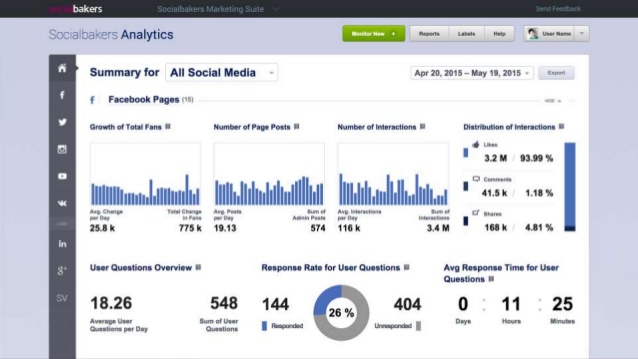
Socialbakers
With Socialbakers, you can get a free report on your most popular Instagram photos, filters, and hashtags, and all of your interactions with followers. The most useful sections are the most liked and most commented posts because this information can help inform the types of images you use in future Instagram posts.
To get your free report, go to Socialbakers’ Free Instagram Analytics Tool and click Login With Instagram.
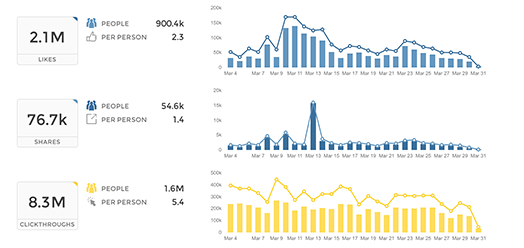
Simply Measured
Simply Measured offers a free Instagram report for users with up to 25,000 followers. The stats and insights are presented clearly and will help inform your Instagram posting strategy. The report lets you quickly see what has worked well in your Instagram marketing, so you can apply these insights to future posts. To get started, type your Instagram account name in the text box and click Authenticate With Any Instagram Account. Then log in and authorize Simply Measured to access information from your Instagram account. When you receive your report, you’ll find three tabs of information: Charts, Scorecard, and Appendix. The buttons in the top-right corner of the screen let you download the report to Excel or export it to PowerPoint.
On the Charts tab, you can view a wealth of insights about your most engaging posts and average engagement per post. Moreover, the Engagement chart shows Instagram engagement over time. See total engagement, engagement as a percentage of followers, and information on likes and comments your photos and videos received.
You can also examine the Scorecard (it gives you some basic stats about your Instagram account) and Appendix Tabs (check out a table of your top posts sorted by highest engagement with the date of the post, type, likes, comments, and total engagement – likes and comments).
It offers a free Instagram account checkup to assess how you’re doing on the network. While the report isn’t as comprehensive as some others, it offers handy nuggets of data for marketers. It helps you determine the best time to post, which hashtags to use, and what content to post more (or less) of. It also highlights your top followers and reminds you to engage with them. To access your free report, click Start Your Checkup on the home page and then sign up for a Union Metrics account.
You can view the number of posts by day. Use the icons in the top-right corner of the page to share, print, or download your report. Scroll down to examine more stats with recommendations from Union Metrics, such as the best time and day to post. You can also view stats and visuals for your top-performing posts. If you click the circles on the hashtag report, you can see more information about the hashtags, which is a handy feature.
Squarelovin
With Squarelovin, you can get free basic Instagram analytics. The Optimization section offers insights that help inform Instagram posting. The “worst times to post” information is especially valuable. First, you’ll need to sign up for a Squarelovin account. On your dashboard, you can view high-level stats and access additional analytics screens. On the Postings tab, you’ll get information on your post history and top posts. It also shows your posts by year and month and day and time. The Engagement tab shows information on likes and comments, and highlights the top liked and top commented posts. The Optimization tab shows the best time and day to post on Instagram, but also the worst times to post on specific days.
If you use different filters on Instagram, you can also view the impact of those filters. Moreover, the report lets you see all of the Instagram hashtags you’ve used next to a list of the most popular hashtags. You can quickly see if you’re using top hashtags or if you need to rethink your hashtag strategy.
Understanding whom your Instagram fans are and what content they engage with and when will give you ideas for future content to share on the network.